Solana Price Prediction: An Inverted Hammer Candlestick Indicates A 38% Upside


Sol price is consolidating below the critical moving averages since April 9. Currently, the sol buyers are making efforts to make a comeback, but face upside challenges. The recent downswing has pushed it below a long-standing trend line, indicating a bearish outlook.
- Sol price remains muted with sideways movement.
- Expect, an ascent of 38% from the current levels with the formation of ‘inverted hammer formation.
- A daily close below $0.98 will invalidate the bullish outlook in the pair.
Sol price trades near support
Sol price is currently trading near $0.70, oscillating near a well-guarded support zone. This is a support-turned-resistance level. Now, the formation of an ‘inverted hammer’ indicates a reversal is around the corner.
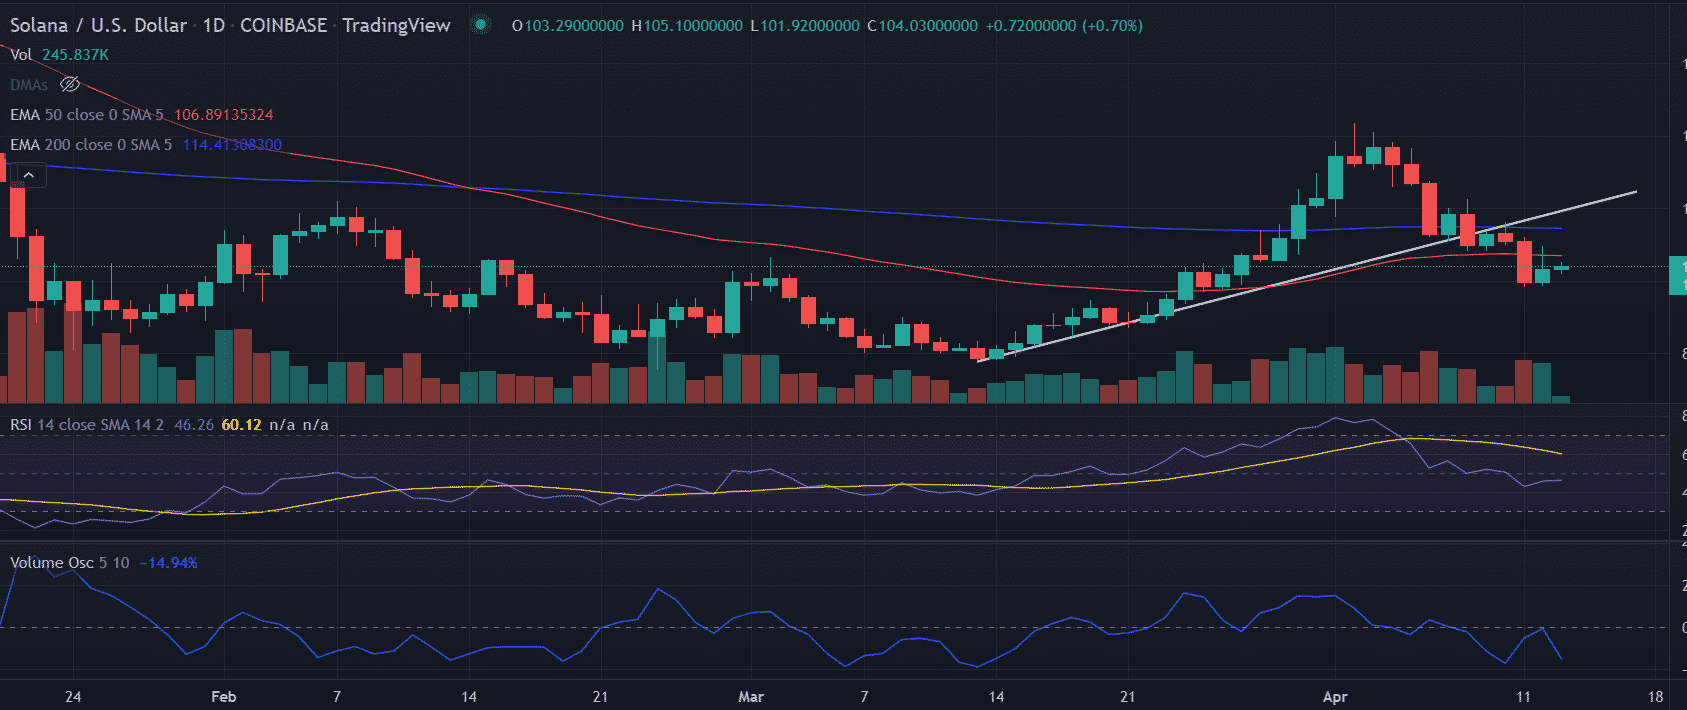
However, still upside challenges lie in the form of the crucial moving averages placed at the 50-day and 200-day EMAs (exponential moving averages) at $106.88 and $114.42 respectively. If the price managed to move beyond the mentioned filters, the next hurdle will be faced near the ascending trend line at $120.
An acceptance above $120.0 will validate the bullish outlook in the price. As of now, the SOL buyers will flex their muscles to take out the highs of April 2 at $143.57.
While, all things look positive for SOL price, still a spike in the sell order would result in the break of the $0.90 support level.
On moving downside, the sellers would collect the liquidity around $0.80.
As of press time, SOL/USD reads at $103.76, up 0.49% for the day.
Technical indicators:
RSI: The daily relative strength index hovers near the average line with a neutral bias. Any uptick in the indicator would support the bullish outlook.
Volume Indicator: The indicator approaches the oversold zone with the decline in the price. A bounce-back is expected.

Why Trust CoinGape
CoinGape has covered the cryptocurrency industry since 2017, aiming to provide informative insights Read more…to our readers. Our journal analysts bring years of experience in market analysis and blockchain technology to ensure factual accuracy and balanced reporting. By following our Editorial Policy, our writers verify every source, fact-check each story, rely on reputable sources, and attribute quotes and media correctly. We also follow a rigorous Review Methodology when evaluating exchanges and tools. From emerging blockchain projects and coin launches to industry events and technical developments, we cover all facets of the digital asset space with unwavering commitment to timely, relevant information.

Related Articles


- Bitcoin vs Gold Feb 2026: Which Asset Could Spike Next?
- Top 3 Reasons Why Crypto Market is Down Today (Feb. 22)
- Michael Saylor Hints at Another Strategy BTC Buy as Bitcoin Drops Below $68K
- Expert Says Bitcoin Now in ‘Stage 4’ Bear Market Phase, Warns BTC May Hit 35K to 45K Zone
- Bitcoin Price Today As Bulls Defend $65K–$66K Zone Amid Geopolitics and Tariffs Tensions
- COIN Stock Price Prediction: Will Coinbase Crash or Rally in Feb 2026?
- Shiba Inu Price Feb 2026: Will SHIB Rise Soon?
- Pi Network Price Prediction: How High Can Pi Coin Go?
- Dogecoin Price Prediction Feb 2026: Will DOGE Break $0.20 This month?
- XRP Price Prediction As SBI Introduces Tokenized Bonds With Crypto Rewards
- Ethereum Price Rises After SCOTUS Ruling: Here’s Why a Drop to $1,500 is Possible


