 Buy $GGs
Solana Price Prediction As Bulls Recover From FTX Losses; Will $SOL Hit $50?


Solana Price Prediction: As rumors circulate about the approval of a Spot Bitcoin ETF, the crypto market has been on a bullish upswing for the past fortnight. Among the major beneficiaries is Solana (SOL), which has seen a phenomenal recovery, soaring from an October 13 low of $21.11 to its current trading price of $32.19—a remarkable 55% increase. Coupled with rising trading volume, these indicators point to a likely sustained bull run. However, is this momentum strong enough to propel Solana to the $50 milestone?
Also Read: SOL Price Shoots $30 As Solana Investment Products Record $15 Million Inflows
Is SOL Price Heading to $40?
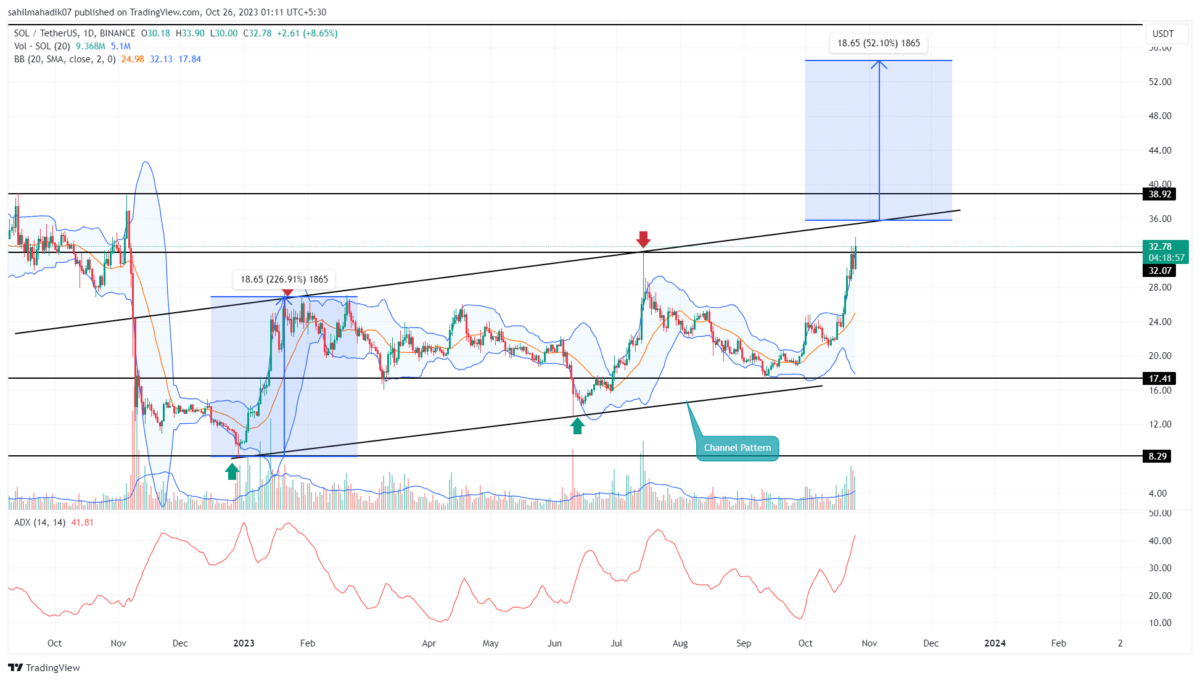
- A rising channel pattern governs the current recovery in SOL price
- A bullish breakout from the pattern overhead trendline could boast the buying momentum.
- The 24-hour trading volume on the Solana coin is $1.5 Billion, indicating a 10% loss.
 Source-Tradingview
In the daily time frame chart, the Solana price shows the formation of a rising channel pattern. Over the past 11 months, the coin price has been resonating within this pattern facing dynamic resistance and support.
With an intraday gain of 1.2%, the asset is inching closer to the channel’s upper trendline, where it may encounter increased supply pressure. Should the bullish momentum break through this upper trendline, it could serve as a springboard for an even more aggressive rally.
According to the pattern’s ideal target, a post-breakout rally could see SOL price surging another 51%, potentially hitting the $54 mark.
Conversely, if the resistance trendline holds firm, we could see a price reversal and continuation of a shallow recovery within the pattern.
Solana Price Technical Analysis
During the second week of November 2022, the Solana Price witnessed a bloodbath due to its relation with the FTX token during its collapse. As a result, the coin witnessed a drop from $31.72 high to a low of $12.37. However, with the current recovery cycle, the coin price has recovered these losses and reached the current trading price of $33. Reclaiming a crucial level of bear attack indicates the buyers have built sufficient momentum to extend the recovery trend.
- Bollinger Band: An upswing in the upper band of the Bollinger band indicator reflects the buying momentum is active
- Average Directional Index: the ADX slope at 41% indicates the buyers could soon run out of steam and may need a pullback.
Play 10,000+ Casino Games at BC Game with Ease
- Instant Deposits And Withdrawals
- Crypto Casino And Sports Betting
- Exclusive Bonuses And Rewards


Why Trust CoinGape
CoinGape has covered the cryptocurrency industry since 2017, aiming to provide informative insights Read more…to our readers. Our journal analysts bring years of experience in market analysis and blockchain technology to ensure factual accuracy and balanced reporting. By following our Editorial Policy, our writers verify every source, fact-check each story, rely on reputable sources, and attribute quotes and media correctly. We also follow a rigorous Review Methodology when evaluating exchanges and tools. From emerging blockchain projects and coin launches to industry events and technical developments, we cover all facets of the digital asset space with unwavering commitment to timely, relevant information.


Related Articles


- Senate Eyes CLARITY Act Markup This Month as Banks, Crypto Continue Stablecoin Yield Talks
- Why XRP Price Rising Today? (2 March)
- Breaking: Bitcoin Price Rises to $70k as Gold Crashes Amid U.S.-Iran Conflict
- Bitcoin News: Anthony Pompliano’s ProCap Buys 450 BTC, Gold Bug Peter Schiff Reacts
- Fed Rate Cuts More Likely If U.S.-Iran Conflict Extends, Arthur Hayes Predicts
- Top 5 Historical Reasons Dogecoin Price Is Not Rising
- Pi Coin Price Prediction for March 2026 Amid Network Upgrade, KYC Boost, Rewards Distribution
- Gold Price Nears ATH; Silver Eyes $100 Breakout on Us- Iran War
- Bitcoin And XRP Price As US Kills Iran Supreme Leader- Is A Crypto Crash Ahead?
- Gold Price Prediction 2026: Analysts Expect Gold to Reach $6,300 This Year
- Circle (CRCL) Stock Price Prediction as Today is the CLARITY Act Deadline


