 Buy $GGs
Solana Price Prediction Signals 20% Rally Ahead, But There’s a Catch


Solana Price Prediction: In the last two weeks, the Solana (SOL) coin has emerged as a standout performer, soaring from a low of $21.01 to a high of $31.3—a staggering 40% increase. This upward momentum has breached some crucial resistance like $25 and brought the coin to a three-month high of $31.4. But how much further can buyers push this rally?
Also Read: SOL Price Shoots $30 As Solana Investment Products Record $15 Million Inflows
Is SOL Price Heading to $36?
- The newfound supply pressure around the $30 mark reflects a minor pullback.
- In a potential pullback, the Coinbase may find suitable support at $26 followed by $24.4.
- The 24-hour trading volume on the Solana coin is $604 Million, indicating a 16% gain.
 Source-Tradingview
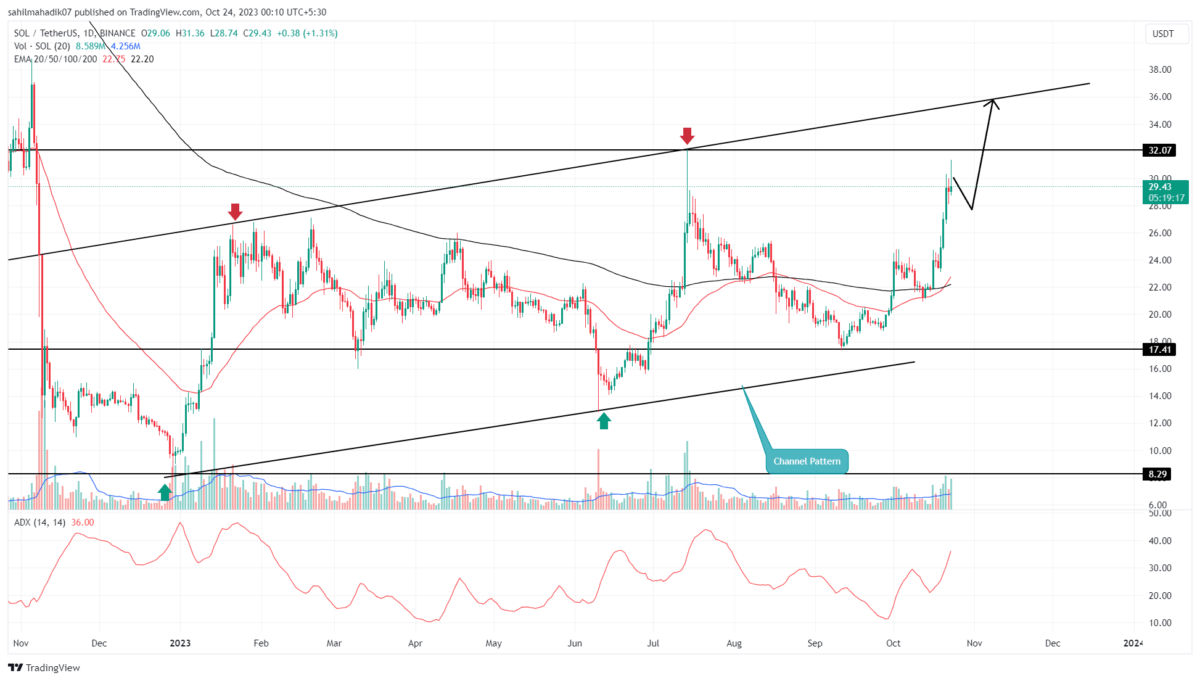
On the daily chart, the Solana price is exhibiting a steady recovery, adhering to the formation of a rising channel pattern. In the last 10 months, the pattern’s twin trendlines have acted as dynamic support and resistance levels for market participants.
Fueled by the current market sentiment and an intraday gain of 1.3%, the coin is steadily approaching the channel’s upper trendline. If buying pressure is sustained, the SOL price could potentially gain another 20%, aiming for the overhead resistance level of around $36.
However, today’s daily candle shows a long-wick rejection near the $30 psychological resistance, indicating that a minor pullback may be on the horizon. Interestingly, during its current rally, this altcoin has experienced similar pullbacks but has never fallen below the 61.8% or 50% Fibonacci retracement levels.
Therefore, the expected pullback could find ample support at around the $26 level, followed by the $24.4 level, providing enough fuel for the coin to resume its bullish trajectory toward the aforementioned target.
Can Buyers Sustain the Current Recovery?
Given the high volatility the SOL price has witnessed over the past 10 months, its adherence to a rising channel pattern suggests a relatively steady recovery is possible as long as these trendlines hold. While the lower trendline offers a safety net against major corrections, a breakout above the upper trendline could set the stage for a more aggressive rally.
- Bollinger Band: An upswing in the upper boundary of the Bollinger band indicator reflects the buying momentum is aggressive
- Average Directional Index: An uptick in the ADX of around 36% reflects the buyer’s decline.
Play 10,000+ Casino Games at BC Game with Ease
- Instant Deposits And Withdrawals
- Crypto Casino And Sports Betting
- Exclusive Bonuses And Rewards


Why Trust CoinGape
CoinGape has covered the cryptocurrency industry since 2017, aiming to provide informative insights Read more…to our readers. Our journal analysts bring years of experience in market analysis and blockchain technology to ensure factual accuracy and balanced reporting. By following our Editorial Policy, our writers verify every source, fact-check each story, rely on reputable sources, and attribute quotes and media correctly. We also follow a rigorous Review Methodology when evaluating exchanges and tools. From emerging blockchain projects and coin launches to industry events and technical developments, we cover all facets of the digital asset space with unwavering commitment to timely, relevant information.

Related Articles


- Fed Rate Cut Odds Drop as Inflation Fears Rise Due To U.S. Iran Conflict
- Here’s Why Tether Gold (XAUt) Price Is Falling Even With Growing Gold Demand
- XRP News: Ripple Expands Payments Platform To Unify Fiat and Stablecoins Globally
- U.S.–Iran War: Bitcoin Price Extends Decline as Oil Prices Surge To Two-Year High
- Bitcoin Treasury Firm MARA Considers Selling BTC Reserves After Policy Update
- Gold Price Prediction March 2026: Rally, Crash, or Record Highs?
- RIOT Stock Prediction as Needham, Piper Sandler Slash Target After Earnings
- Cardano Price Outlook As Charles Hoskinson Warns Over CLARITY Act
- Circle Stock Price Climbs 15% to $96, Can Rally Continue in March 2026?
- Bitcoin Price Prediction as US-Iran War Enters 4th Consecutive Day
- Top 5 Historical Reasons Dogecoin Price Is Not Rising


