 Claim Card
Solana Price Prediction: Will $20 Breakdown Trigger Further Correction?


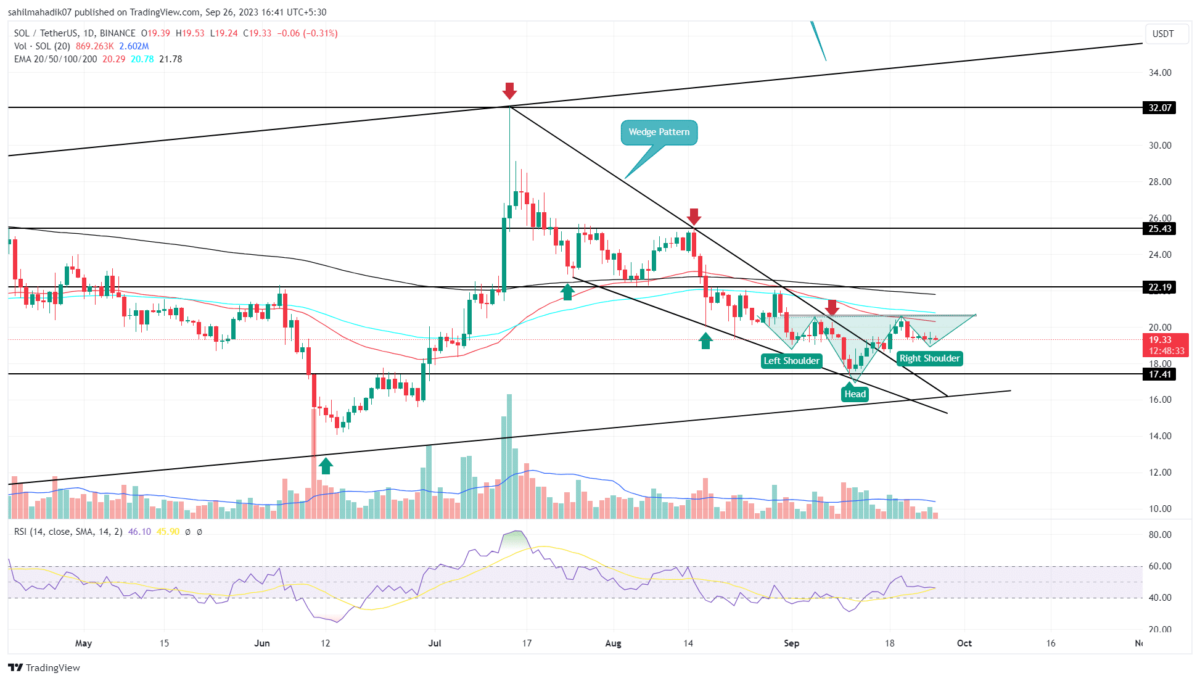
In the midst of a broader crypto market downturn, the Solana price recently encountered resistance at the $20.6 level, leading to a temporary retracement to $19.1. Although this appears as a 7% decline at first glance, the underlying technicals tell a different story. According to the daily time frame chart, this pullback serves as a crucial component of a bullish reversal indicator called an inverted head and shoulders pattern.
Also Read: SOL Price Jumps 5% to $20, What’s Next for Solana?
Chart Pattern Hints Recovery Phase Ahead
- The 200-day EMA wavering around $22 creates a strong resistance zone.
- Combining the bullish chart patterns—the inverted head and shoulders and the falling wedge—Solana coin appears well-positioned for an upward swing
- The 24-hour trading volume on the Solana coin is $161.4 Million, indicating a 13% gain.
 Source-Tradingview
Over the past week, the SOL price has painted a picture of indecisiveness, as reflected by the formation of neutral doji candles in the daily charts. This pause in price movement came on the heels of a previous sharp decline, suggesting that bears are losing their grip and failing to extend their territory.
Such stalling often indicates a transition phase in market dynamics. Within this context, the most recent pullback serves to complete the right shoulder of an inverted head and shoulders pattern. Following this classic bullish reversal setup, the Solana coin appears poised to rebound from the $19.1 support level to retest the neckline resistance at $20.80.
A successful break above this neckline resistance would likely serve as the catalyst for an accelerated bullish movement. Upon breaching this barrier, technical models suggest that the next logical target for this altcoin could be around $22.20.
SOL Price To Hit $30?
Amid the third-week recovery in the crypto market, the Solana coin gave a bullish breakout from a long-coming falling wedge pattern. This pattern had led to a correction trend for over two months, reflecting its breakout as an important shift in market sentiment. In theory, each swing high retesting the pattern’s resistance trendline stands as a potential target. Thus the anticipated upswing in SOL price is likely to hit $22.2, followed by $25.4, followed by $32
- Relative Strength Index: The daily RSI slope above 40% reflects sufficient bullish momentum for an upswing.
- Exponential Moving Average: The coin price trading below the daily EMAs(20, 50, 100, and 200) indicates the major trend is still bearish.

Why Trust CoinGape
CoinGape has covered the cryptocurrency industry since 2017, aiming to provide informative insights Read more…to our readers. Our journal analysts bring years of experience in market analysis and blockchain technology to ensure factual accuracy and balanced reporting. By following our Editorial Policy, our writers verify every source, fact-check each story, rely on reputable sources, and attribute quotes and media correctly. We also follow a rigorous Review Methodology when evaluating exchanges and tools. From emerging blockchain projects and coin launches to industry events and technical developments, we cover all facets of the digital asset space with unwavering commitment to timely, relevant information.

Related Articles


- Third Spot SUI ETF Goes Live as 21Shares Fund Launches on Nasdaq
- Mark Zuckerberg’s Meta Reportedly Eyes Stablecoin Integration This Year Amid Regulatory Clarity
- Coinbase Rivals Robinhood As It Rolls Out Stocks, ETFs Trading In ‘Everything Exchange’ Push
- UAE’s Second Largest Bank Eyes Bitcoin Allocation, Backs Tokenization
- Crypto Group Proposes Tax Rules To Boost Innovation As CLARITY Act Talks Progress
- Pi Network Price Eyes a 30% Jump as Migrations Jumps to 16M
- Will Ethereum Price Dip to $1,500 as Vitalik Buterin Continues Selling ETH?
- XRP Price Outlook as Clarity Act Passage Odds Plunge to 53%
- COIN Stock Risks Crashing to $100 as Odds of US Striking Iran Jump
- MSTR Stock Price Predictions As Michael Saylor’s Strategy Makes 100th BTC Purchase
- Top 3 Meme Coins Price Prediction As BTC Crashes Below $67k


