Solana (SOL) Price Prediction: SOL Retest Weekly Lows Near $88, Is time to Enter!


Solana (SOL) price edges lower as the fresh trading week begins. SOL has tested the lower trading range of the consolidation begins on January 22. On the weekly chart, SOL price has tested multiple weekly support around $87 and could drop toward the lows last seen in August at $66.21.
- Solana’s (SOL) price continues to trade lower on Monday.
- Investors expect a turnaround from the critical support level.
- However, the downside risk remains intact below $80.0.
At the time of writing, SOL/USD is trading at $87.99, down 3.40%. As per the CoinMarketCap, the 8th largest cryptocurrency 24-hour trading volume stands at $2,233,525,534 with 60% gains.
SOL price trades near critical level
On the daily chart, Solana’s (SOL) price action flipped near the resistance-turned-support level around $88.0. The price surged 51% from the lows of January low of $80.79. Further, after the swing highs made on February 7 at $122.0 SOL makes a healthy retracement near the reliable support.
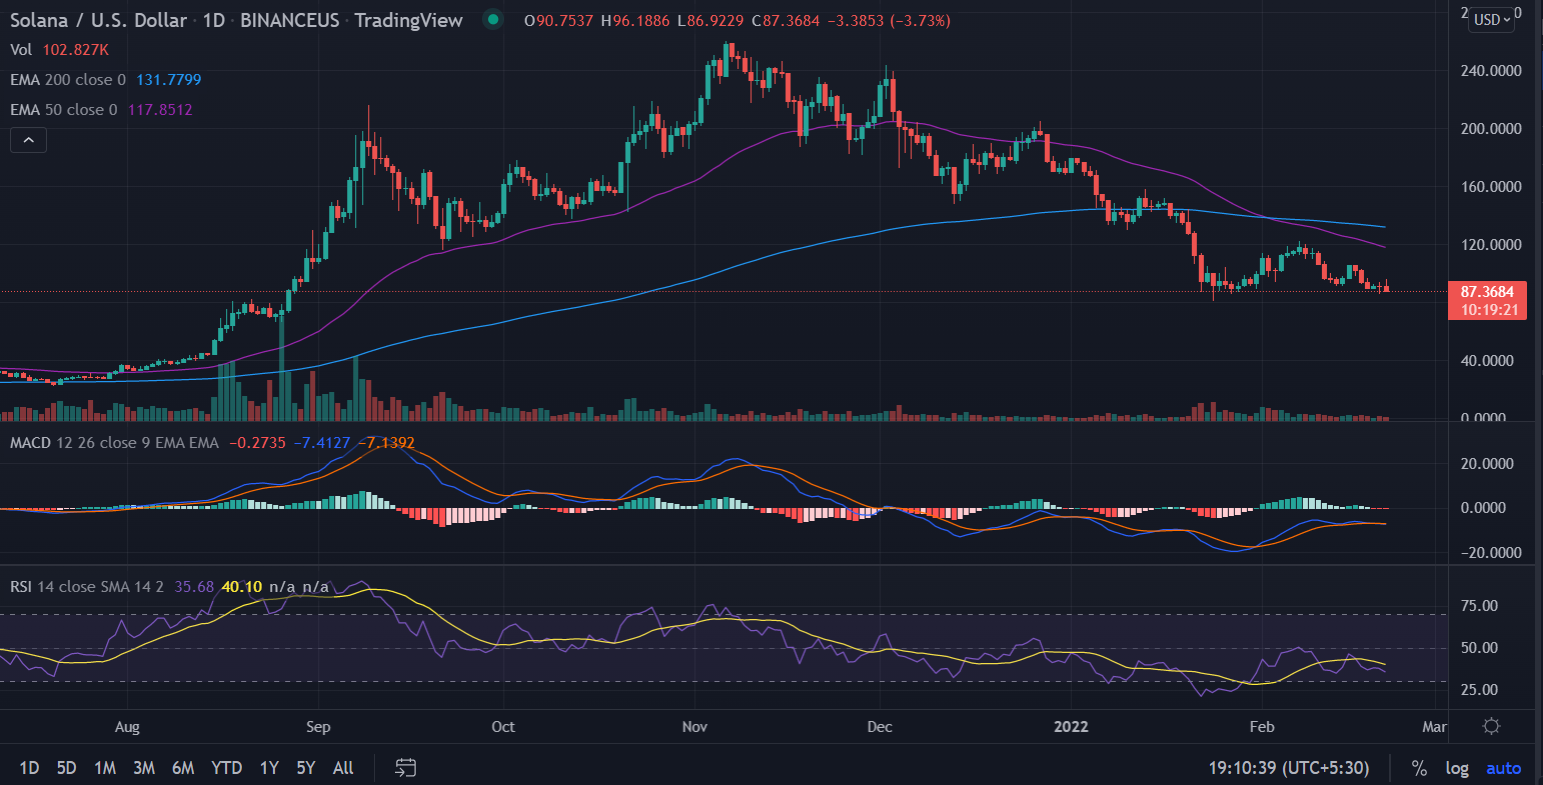
If the price is able to sustain the crucial support level then SOL/USD has the potential for reversal. The immediate first target could be found at the psychological $100.0 level followed by a meeting of the 50-day EMA (Exponential Moving Average) at 121.43.
Furthermore, a decisive close above the 50 and 200 EMA crossover SOL has the potential to the psychological level of $150.0.
On the flip side, a spike in the sell order could result in the failure to sustain the mentioned critically could drop toward the lows last seen in August near $72.0.
Technical indicators
RSI: The Daily Relative Strength Index (RSI) holds below 35 and is approaching the oversold zone.
MACD: The Moving Average Convergence Divergence (MACD) hovers below the midline with a bearish bias.

Why Trust CoinGape
CoinGape has covered the cryptocurrency industry since 2017, aiming to provide informative insights Read more…to our readers. Our journal analysts bring years of experience in market analysis and blockchain technology to ensure factual accuracy and balanced reporting. By following our Editorial Policy, our writers verify every source, fact-check each story, rely on reputable sources, and attribute quotes and media correctly. We also follow a rigorous Review Methodology when evaluating exchanges and tools. From emerging blockchain projects and coin launches to industry events and technical developments, we cover all facets of the digital asset space with unwavering commitment to timely, relevant information.

Related Articles


- Bitcoin Price Today As Bulls Defend $65K–$66K Zone Amid Geopolitics and Tariffs Tensions
- XRP Realized Losses Spike to Highest Level Since 2022, Will Price Rally Again?
- Crypto Market Rises as U.S. and Iran Reach Key Agreement On Nuclear Talks
- Trump Tariffs: U.S. Raises Global Tariff Rate To 15% Following Supreme Court Ruling
- Bitwise CIO Names BTC, ETH, SOL, and LINK as ‘Mount Rushmore’ of Crypto Amid Market Weakness
- Pi Network Price Prediction: How High Can Pi Coin Go?
- Dogecoin Price Prediction Feb 2026: Will DOGE Break $0.20 This month?
- XRP Price Prediction As SBI Introduces Tokenized Bonds With Crypto Rewards
- Ethereum Price Rises After SCOTUS Ruling: Here’s Why a Drop to $1,500 is Possible
- Will Pi Network Price See a Surge After the Mainnet Launch Anniversary?
- Bitcoin and XRP Price Prediction As White House Sets March 1st Deadline to Advance Clarity Act


