
Solana (SOL) Price Today: SOL Trades In Downward Channel, Looks Up For $135.0


Solana’s (SOL) price remains consolidated in today’s session. SOL witnessed a bounce back from the recent consolidation. However, the upside was stopped due to a stiff resistance barrier that resulted in a minor pullback. SOL bulls are in control of the trend as gathering the momentum near the current levels.
- Solana’s price locks in modest gains on Saturday.
- Price slips below the crucial 50-day SMA near $203.50
- Momentum oscillators warn of aggressive bids.
Solana keeps eye on 50-day SMA
On the daily chart, the Solana price observed a correction of nearly 11% after attacking the $115.51 to $152 supply zone for the second time. The downside momentum found support at the $80.0 barrier and formed the base for a fresh round of buying.
A renewed buying pressure will pursue the next course of action to tag the higher level. This time around, investors can expect the SOL price to test the upper trend line of the downside channel at $125 followed by the ultimate target of $135. This also coincides with the placement of the 50-day Simple Moving Average (SMA).
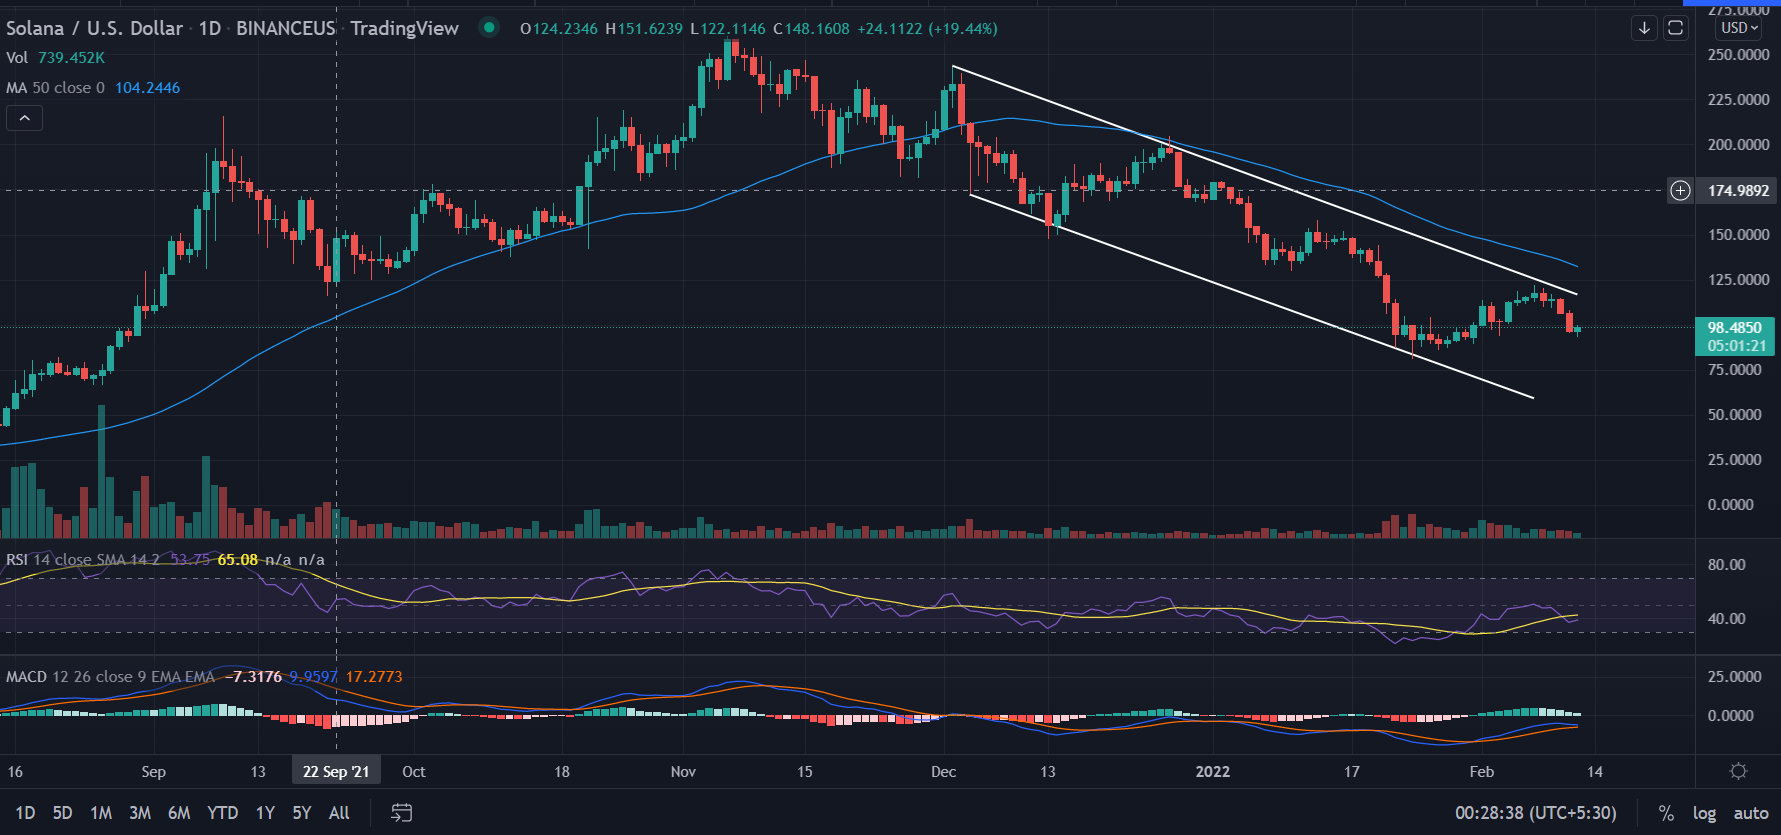
This would mark an ascent of 56% from the lows of $110.03, where the recent downside is capped for the SOL. Bulls need to deploy extra strength to carry the current upside momentum further to a higher level.
On the other hand, if the price continued to move inside the downward channel then a break could lead to a retest of the $80.0 barrier. This movement would provide another chance for bulls to pull up around $100. However, a failure would take the control off from the buyers.
Furthermore, a daily candlestick below $92.0 will invalidate the bullish outlook for the pair. In that scenario, SOL could revisit the daily demand zone placed near $50.0 to $80.0.
Technical Indicators:
RSI: The Daily Relative Strength Index (RSI) trades at 38 with a bullish crossover.
MACD: The Moving Average Convergence Divergence (MACD) still hovers below the midline.
Play 10,000+ Casino Games at BC Game with Ease
- Instant Deposits And Withdrawals
- Crypto Casino And Sports Betting
- Exclusive Bonuses And Rewards


Why Trust CoinGape
CoinGape has covered the cryptocurrency industry since 2017, aiming to provide informative insights Read more…to our readers. Our journal analysts bring years of experience in market analysis and blockchain technology to ensure factual accuracy and balanced reporting. By following our Editorial Policy, our writers verify every source, fact-check each story, rely on reputable sources, and attribute quotes and media correctly. We also follow a rigorous Review Methodology when evaluating exchanges and tools. From emerging blockchain projects and coin launches to industry events and technical developments, we cover all facets of the digital asset space with unwavering commitment to timely, relevant information.


- MetaMask Launches Official MASK Token — Free Airdrop for All Wallet Users
- Phantom Wallet Announces $PHTM Token — 200M Tokens in Community Airdrop
- Phantom Wallet Team Launches WAR Token on Solana — Free Claim Open for SOL Holders
- MetaMask Confirms MASK Token Distribution — Eligible Wallets Can Claim Now
- Will CLARITY Act Pass in 2026? Galaxy’s Alex Thorn Warns April Deadline Is Critical
- Cardano’s $0.50 Resistance- Can “Midnight” Alpha Defy the Fog of War?
- Bitcoin and XRP Price Outlook If the Senate Banking Committee Approves the CLARITY Act
- Official Trump Price Prediction As TRUMP Token Soars 50% Ahead Mar-a-Lago Invite Buzz for Top Holders
- Solana vs XRP Price Forecast: Can SOL Reclaim Its All-Time High Before XRP Hits $2?
- Top Analyst Predicts Cardano Price Could Surge 100% As Bitcoin Breaks $72k
- What’s Keeping Shiba Inu Below $0.0000065- Analyst Predicts 30% Rise Ahead


