Synthetix Looks For 14% Gains Following This Bullish Formation


The Synthetix price analysis is bullish today. The price is gearing up to mint more gains amid the recent bullish market structure. However, additional buying interest is required to break through the ongoing consolidation. If the price could breach the $3.20 hurdle, it would be a discount buying opportunity for the sidelined investors.
As of press time, SNX/USD is exchanging hands at $3.04, up 0.79% for the day. The 24-hour trading volume shoots up 167% to $155,625,035 according to CoinMarketCap data.
- Synthetix price edges higher extending the days of consolidation.
- A bullish formation on the daily chart makes the bulls hopeful.
- However, a daily close below $2.92 would be a concern for the buyers.
Synthetix price extends consolidation
On the daily chart, the Synthetix price is trading inside a “Rising Channel” pattern, forming higher highs and lows.
Currently, SNX is hovering near the support level of the channel. The price took a deep dive from its recent swing high due to the emergence of the sellers to its recent lows with a more than 35% fall, extending from August 11 to August 20.
To add more pressure, the price slipped below the 50-day exponential moving average, implying a worrisome.
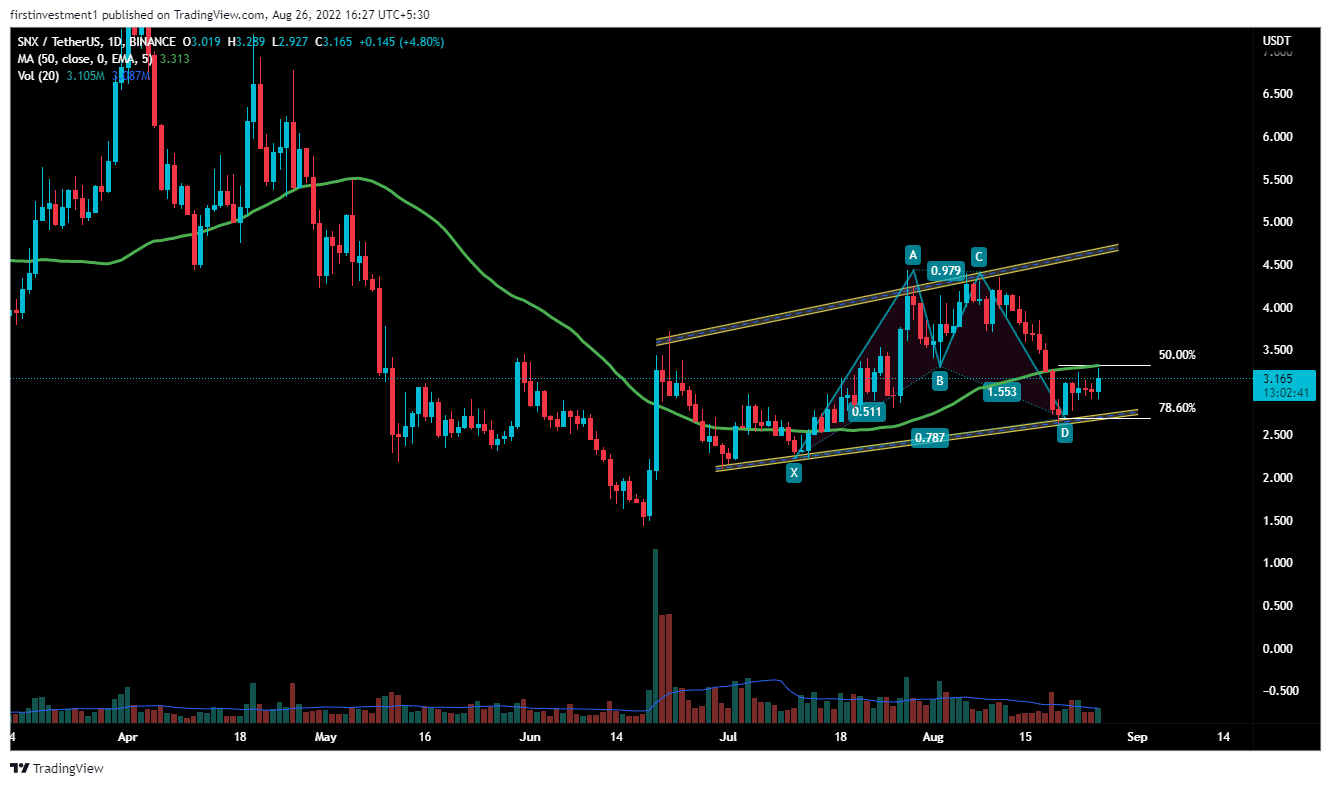
Further, the formation of a bullish harmonic pattern called the “Gartley pattern”, gives a positive sentiment. It’s a short-term reversal pattern, which occurs when the price starts to reverse from 78.6% of the Fibonacci retracement of its previous trend.
As per the pattern, we can expect a bounce toward 50% Fib. level ($3.53) to 61.8% fib. Level ($3.72).
The nearest support is the swing low, which is $2.92, whereas the nearest resistance could be found at $3.35. There is a higher probability of the price breaking the resistance level, & reach its given targets. “Buying on dips” is the best course of action we can go with.
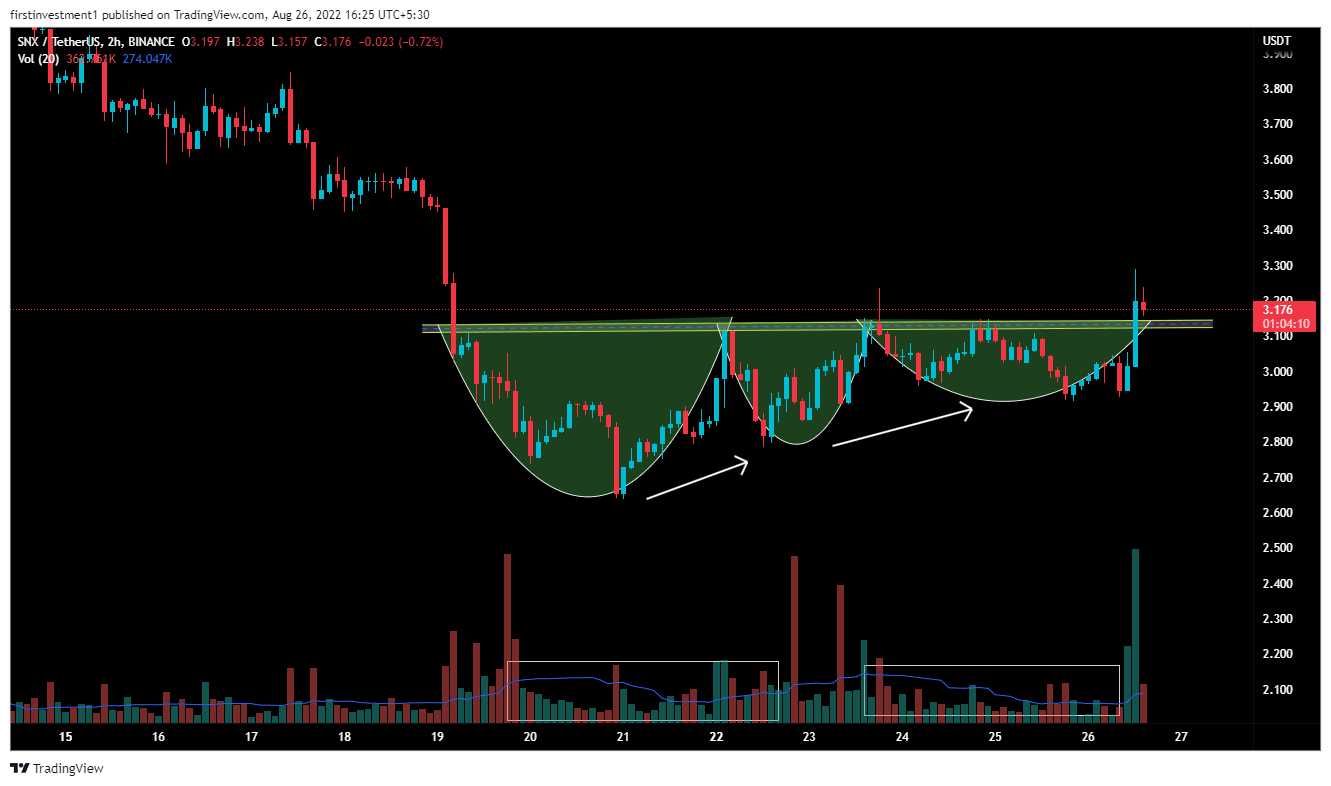
On the two-hour time frame, SNX produces a breakout of a “Volume Contraction” Pattern.
The key to this pattern is that there needs to be a contraction of volatility as the chart moves from the left to the right. This highlights that the volume available is decreasing and becoming scarce. In addition, the more dramatic in volume, the more likely that the move will be explosive. Above the breakout is accompanied by an increase in the relative volume.
In contrast, a break below the $2.920 level could invalidate the bullish outlook. And the price can be below $2.80
SNX is slightly bullish on all time frames. above $3.20 closing on the hourly time frame, we can put a trade on the buy side.

Why Trust CoinGape
CoinGape has covered the cryptocurrency industry since 2017, aiming to provide informative insights Read more…to our readers. Our journal analysts bring years of experience in market analysis and blockchain technology to ensure factual accuracy and balanced reporting. By following our Editorial Policy, our writers verify every source, fact-check each story, rely on reputable sources, and attribute quotes and media correctly. We also follow a rigorous Review Methodology when evaluating exchanges and tools. From emerging blockchain projects and coin launches to industry events and technical developments, we cover all facets of the digital asset space with unwavering commitment to timely, relevant information.

Related Articles


- Trump Tariffs: U.S. Raises Global Tariff Rate To 15% Following Supreme Court Ruling
- Bitwise CIO Names BTC, ETH, SOL, and LINK as ‘Mount Rushmore’ of Crypto Amid Market Weakness
- Prediction Market News: Kalshi Faces New Lawsuit Amid State Regulatory Crackdown
- Will Bitcoin Crash To $58k or Rally to $75k After Hot PCE Inflation Data?
- Ripple’s RLUSD Gets Institutional Boost as SEC Eases Stablecoin Rules for Broker-Dealers
- Dogecoin Price Prediction Feb 2026: Will DOGE Break $0.20 This month?
- XRP Price Prediction As SBI Introduces Tokenized Bonds With Crypto Rewards
- Ethereum Price Rises After SCOTUS Ruling: Here’s Why a Drop to $1,500 is Possible
- Will Pi Network Price See a Surge After the Mainnet Launch Anniversary?
- Bitcoin and XRP Price Prediction As White House Sets March 1st Deadline to Advance Clarity Act
- Top 3 Price Predictions Feb 2026 for Solana, Bitcoin, Pi Network as Odds of Trump Attacking Iran Rise


