 Buy $GGs
Technical Analysis Hints An Upcoming Discount In Polygon Price; Buy Again?


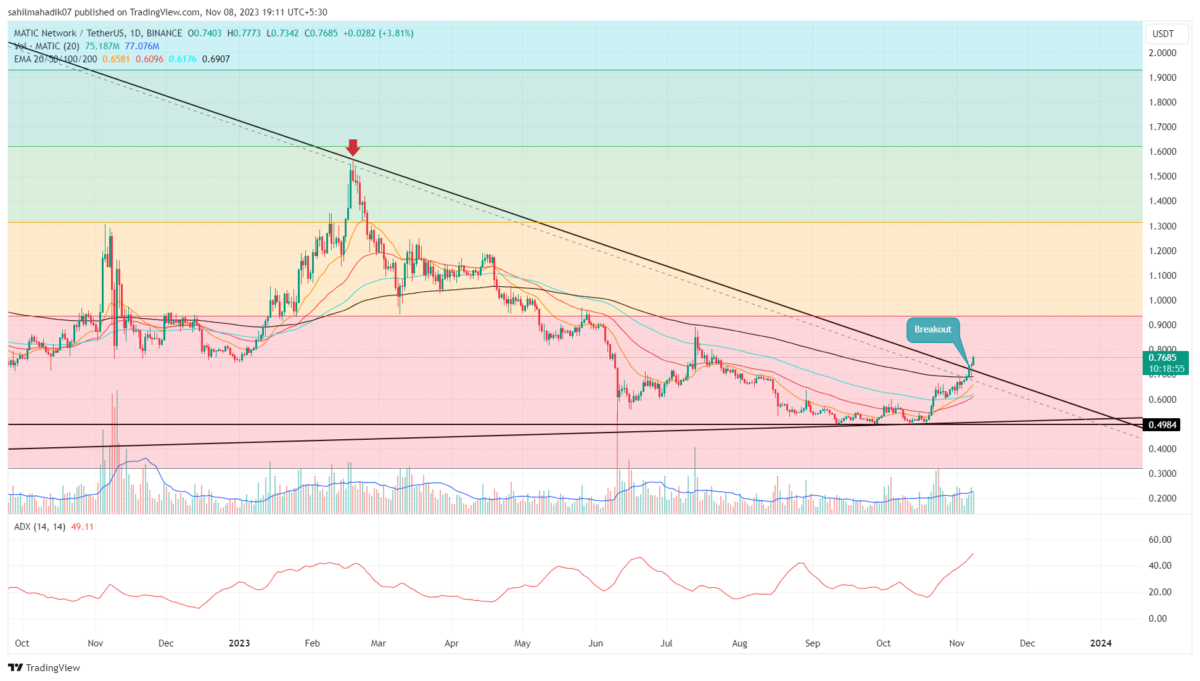
The fast-recovering Polygon price shows the parallel channel formation in the daily time frame chart. As a result, the prices actively respond to two ascending trendlines leading the prices to higher ground. Thus, until the pattern’s support trendline is intact, the mark participants could witness a steady rally with occasion pullbacks.
Key points
- In response to the channel pattern, the polygon coin price could witness significant correction in coming trading sessions.
- The reclaimed crucial EMAs could offer firm support during a possible pullback.
- The intraday trading volume in the MATIC is $1.28 Billion, indicating a 67.5% gain.
 Source- –Tradingview
Two major announcements, including the Web2 giant Meta partnership with Polygon for buying and selling NFTs on Instagram and America’s largest bank, JP Morgan, successfully executing its trades using the Polygon blockchain network, caused a significant inflow in MATIC price.
Thus, the altcoin jumped from $0.87 to $1.3, registering around 50% growth. Moreover, the increased volume and whales accumulation accentuated a genuine recovery in polygon coin price.
However, the daily candles have shown higher price rejection over the past three days, indicating exhausted bullish momentum. Thus, a bearish reversal from the aforementioned pattern’s trendline will trigger a bear cycle.
In ideal conditions, the bear cycle within the channel pattern should lead prices back to the bottom trendline. This potential downfall could plummet the price 20% down to hit combined support of $0.95 and support trendline. Thus, retesting the trendline mentioned above offers a pullback opportunity to reaccumulate MATIC.
Conversely, a breakdown below the bottom trendline will undermine the bullish theory.
Technical Indicators
RSI indicator: the daily-RSI slope reverted from the overbought region, suggesting the prices could witness a significant correction to stabilize the last recovery.
EMAs: the rising prices reclaimed the crucial EMAs(20, 50, 100, and 200), indicating an overall bullish outlook for Polygon. Moreover, a potential golden crossover between the 50-and-200-day EMA could offer a strong buy signal.
Polygon Coin Price Intraday Levels
- Spot rate: $1.196
- Trend: Bullish
- Volatility: Medium
- Resistance levels- $1.2 and $1.3
- Support levels- $1.02 and $0.95
Play 10,000+ Casino Games at BC Game with Ease
- Instant Deposits And Withdrawals
- Crypto Casino And Sports Betting
- Exclusive Bonuses And Rewards


Why Trust CoinGape
CoinGape has covered the cryptocurrency industry since 2017, aiming to provide informative insights Read more…to our readers. Our journal analysts bring years of experience in market analysis and blockchain technology to ensure factual accuracy and balanced reporting. By following our Editorial Policy, our writers verify every source, fact-check each story, rely on reputable sources, and attribute quotes and media correctly. We also follow a rigorous Review Methodology when evaluating exchanges and tools. From emerging blockchain projects and coin launches to industry events and technical developments, we cover all facets of the digital asset space with unwavering commitment to timely, relevant information.

Related Articles


- “There Is Only One Gold,” Billionaire Ray Dalio Says Amid BTC’s Quantum Threats
- Goldman Sachs CEO Predicts ‘Weeks’ of Crypto Market Crash as U.S Iran War Continues
- Polymarket Axes ‘Nuclear Detonation’ Prediction Market Amid Public Fury
- Indiana Signs Bitcoin Bill Into Law Allowing Crypto in Retirement Plans
- ‘Time to Act Is Now’: CFTC Chief Pushes Swift Passage of CLARITY Act
- Robinhood Stock Price Prediction As Cathie Wood Buys $12M Dip in Bold ARK Move
- Bitcoin Price At Risk? Professor Who Predicted US-Iran War Says America Could Lose
- Gold Price Prediction March 2026: Rally, Crash, or Record Highs?
- RIOT Stock Prediction as Needham, Piper Sandler Slash Target After Earnings
- Cardano Price Outlook As Charles Hoskinson Warns Over CLARITY Act
- Circle Stock Price Climbs 15% to $96, Can Rally Continue in March 2026?


