 Buy $GGs
Terra Classic Price Analysis: Bearish Pattern Plots $LUNC Price Crash $0.00007; Sell or Hold?


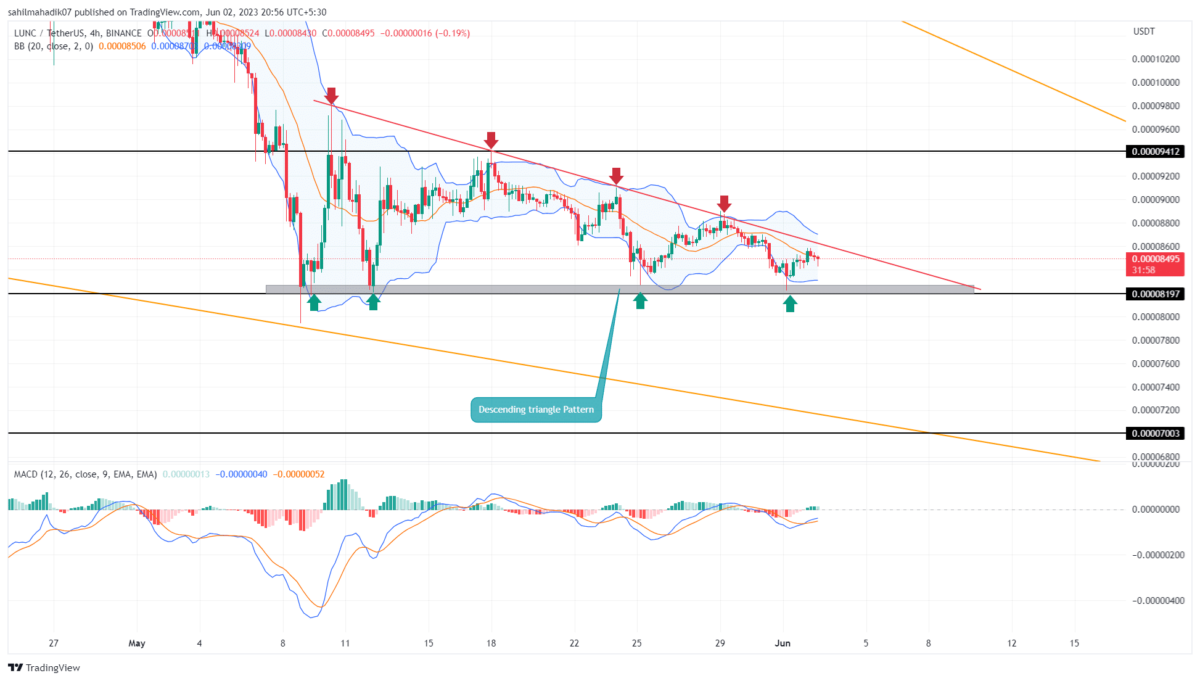
Terra Classic Price Analysis: Over the past three weeks the LUNC price witnessed a lack of dominance from both bulls and bears leading to a narrow range formation. Responding to the broader market uncertainty, the coin price still continues to resonate within the $0.000094 to $0.000082 levels. However, taking a closer look at the lower time frame chart this consolidation phase shows the formation of a bearish pattern called descending triangle giving an extra edge to market sellers.
Also Read: Terra Classic To Reinstate Edward Kim 1.2% Burn Tax To Revive LUNC To $1
LUNC Price Daily Chart
- A descending triangle pattern is a downtrend continuation pattern that accelerates the underlying selling momentum
- Losing the $0.82 neckline support will trigger a quick 15% drop in the LUNC price
- The intraday trading volume in the LUNC coin is $17.1 Million, indicating a 5% loss.
 Source- Tradingview
Amid the ongoing consolidation, the LUNC price bounced off at least four times from the triangle’s pattern resistance trendline and neckline support separately. This reversal indicates the influence of this pattern on market participants and therefore increases its probability to determine future trends.
As the prices shrink within the triangle structure, the selling pressure is also likely to accelerate over time. Thus, a potential breakdown below the $0.000082 neckline with a 4-hour candle closing may tumble the prices 15% down to hit $0.00007.
While the bearish outlook seems reasonable for the LUNC price, a breakout above the overhead trendline will offset the seller’s motive and push altcoin towards $0.000094-$0.000098.
Will LUNC Price Reach $0.00007?
Under the influence of a descending triangle pattern, the LUNC price is likely to prolong its prevailing downtrend. A bearish breakdown below the $0.000082 support will offer a short-selling opportunity to an interested target as the next prominent support lies at $0.00007.
- Bollinger Band: The BB indicator’s contraction suggests an upcoming surge in market volatility, creating a potential trading opportunity for high momentum breakout action.
- Moving Average Convergence Divergence: Multiple crossovers between the MACD(blue) and signal(orange) line project indecisiveness among traders.
Play 10,000+ Casino Games at BC Game with Ease
- Instant Deposits And Withdrawals
- Crypto Casino And Sports Betting
- Exclusive Bonuses And Rewards


Why Trust CoinGape
CoinGape has covered the cryptocurrency industry since 2017, aiming to provide informative insights Read more…to our readers. Our journal analysts bring years of experience in market analysis and blockchain technology to ensure factual accuracy and balanced reporting. By following our Editorial Policy, our writers verify every source, fact-check each story, rely on reputable sources, and attribute quotes and media correctly. We also follow a rigorous Review Methodology when evaluating exchanges and tools. From emerging blockchain projects and coin launches to industry events and technical developments, we cover all facets of the digital asset space with unwavering commitment to timely, relevant information.

Related Articles


- Crypto Market Update: Top 3 Reasons Why BTC, ETH, XRP and ADA is Up
- Crypto News: Bitcoin Sell-Off Fears Rise as War Threatens Iran’s BTC Mining Operations
- U.S.–Iran War: Monday Crypto Crash Odds Rise As Pundits Predict Oil Price Spike
- US-Iran War: Reports Confirm Bombings In UAE, Bahrain and Kuwait As Crypto Market Makes Recovery
- XRP Price Dips on US-Iran Conflict, But Capitulation Signals March Rebound
- Bitcoin And XRP Price As US Kills Iran Supreme Leader- Is A Crypto Crash Ahead?
- Gold Price Prediction 2026: Analysts Expect Gold to Reach $6,300 This Year
- Circle (CRCL) Stock Price Prediction as Today is the CLARITY Act Deadline
- Analysts Predict Where XRP Price Could Close This Week – March 2026
- Top Analyst Predicts Pi Network Price Bottom, Flags Key Catalysts
- Will Ethereum Price Hold $1,900 Level After Five Weeks of $563M ETF Selling?


