 Buy $GGs
Terra Classic Price Analysis: Is $LUNC Price Downtrend Reaching Maturity?


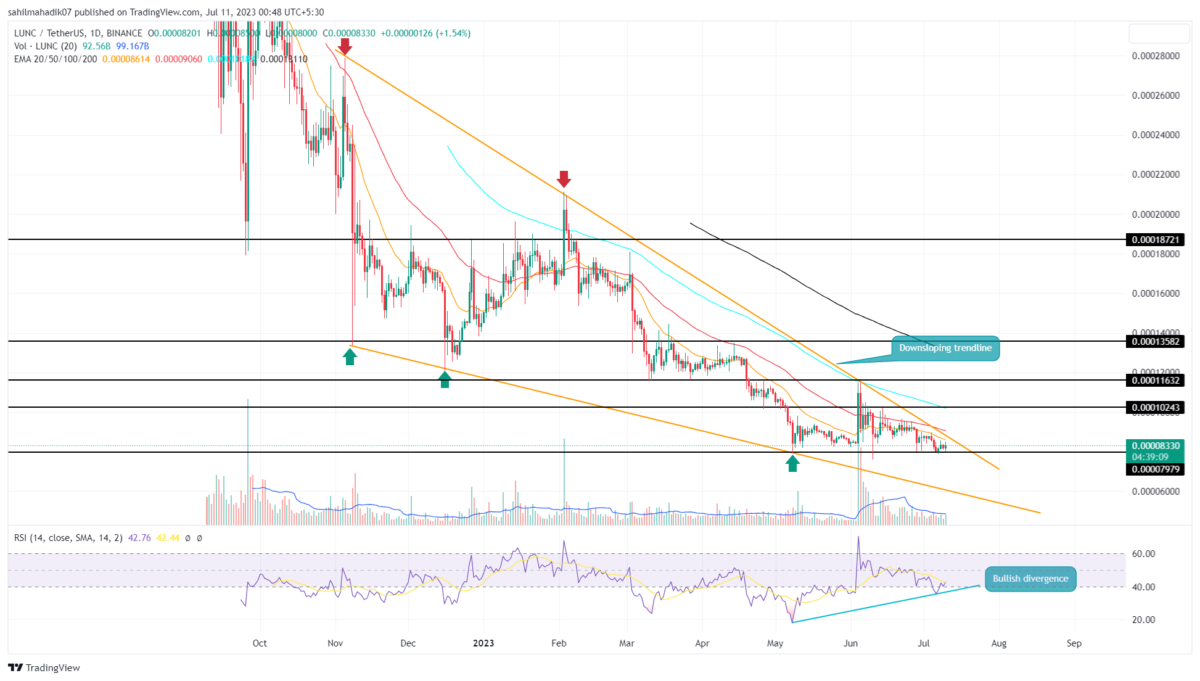
Terra Classic Price Analysis: Over the last seven months, the LUNC coin price showcased an active downtrend under the influence of a falling wedge pattern. The prices have resonated within this pattern’s converging trendline several times, indicating the traders are respecting this setup. However, in theory, this pattern is known to trigger a significant upswing upon the breakout of its trendline. Here’s how potential buyers could benefit from this trendline.
Also Read: LUNC News: Terra Luna Classic L1TF Reveals Plan; Validator Burns To Revive $LUNC To $1?
LUNC Price Daily Chart
- The falling wedge pattern governs the current downturn in the LUNC price
- Losing $0.0008 support will accelerate selling pressure and prolong the current downfall.
- The intraday trading volume in the LUNC coin is $30.2 Million, indicating a 75.2% gain.
 Source- Tradingview
By the press time, the LUNC price trades at $0.0000828 and continues to narrow within the converging trendline of the wedge pattern. This gradual shrinkage indicates a loss of bearish momentum and the possibility of buyers retaking trendline control.
Amid the current consolidation in the crypto market, the LUNC price has obtained strong support from the $0.00008 mark. With an intraday gain of 1.08%, the coin price bounced back from the aforementioned support and prepared for another strike to the overhead trendline.
A potential breakout from the falling trendline will signal an early sign of trend reversal and provide an opportunity to enter a long trade. The post-breakout rally could surge the price to $0.000102, followed by $0.00015.
Will LUNC Price Break $0.00007?
In case the sellers continue to defend the downsloping trendline, the Tera classic coin could witness a breakdown below the $0.00008 support. This breakdown will reflect the continuation of prevailing and plunge the prices to $0.00007 or $0.00006. Thus, a breakout above the resistance trendline is needed to obtain a suitable signal for a bull trend possibility.
Play 10,000+ Casino Games at BC Game with Ease
- Instant Deposits And Withdrawals
- Crypto Casino And Sports Betting
- Exclusive Bonuses And Rewards


Why Trust CoinGape
CoinGape has covered the cryptocurrency industry since 2017, aiming to provide informative insights Read more…to our readers. Our journal analysts bring years of experience in market analysis and blockchain technology to ensure factual accuracy and balanced reporting. By following our Editorial Policy, our writers verify every source, fact-check each story, rely on reputable sources, and attribute quotes and media correctly. We also follow a rigorous Review Methodology when evaluating exchanges and tools. From emerging blockchain projects and coin launches to industry events and technical developments, we cover all facets of the digital asset space with unwavering commitment to timely, relevant information.

Related Articles


- Indiana Signs Bitcoin Bill Into Law Allowing Crypto in Retirement Plans
- ‘Time to Act Is Now’: CFTC Chief Pushes Swift Passage of CLARITY Act
- Trump Tells Congress to Pass Crypto Market Bill ‘ASAP,’ Blasts Banks for Stalling
- BTC Price Bounces as Spot Investors Buy The Dip Amid Iran War Jitters
- CFTC Chief Mike Selig Signals US Crypto Perpetual Futures Rollout in Coming Weeks
- Gold Price Prediction March 2026: Rally, Crash, or Record Highs?
- RIOT Stock Prediction as Needham, Piper Sandler Slash Target After Earnings
- Cardano Price Outlook As Charles Hoskinson Warns Over CLARITY Act
- Circle Stock Price Climbs 15% to $96, Can Rally Continue in March 2026?
- Bitcoin Price Prediction as US-Iran War Enters 4th Consecutive Day
- Top 5 Historical Reasons Dogecoin Price Is Not Rising


