
Terra Classic Price Analysis: Is $LUNC Price Ready to Hit $0.00012?


Terra Classic Price Analysis: Over the five days, the LUNC price showed alternate green and red candles indicating no dominance from buyers or sellers to take trend control. This uncertainty could have arisen as the US SEC filed legal action against the big crypto exchanges Binance(BNB) and Coinbase(COIN). Therefore, the Terra classic coin may see prolonged consolidation in the coming days as the overall trend is bearish under the influence of a wedge pattern.
Also Read: Terra Classic’s Biggest v2.1.0 Parity Upgrade Proposal Officially Passed, LUNC To $1
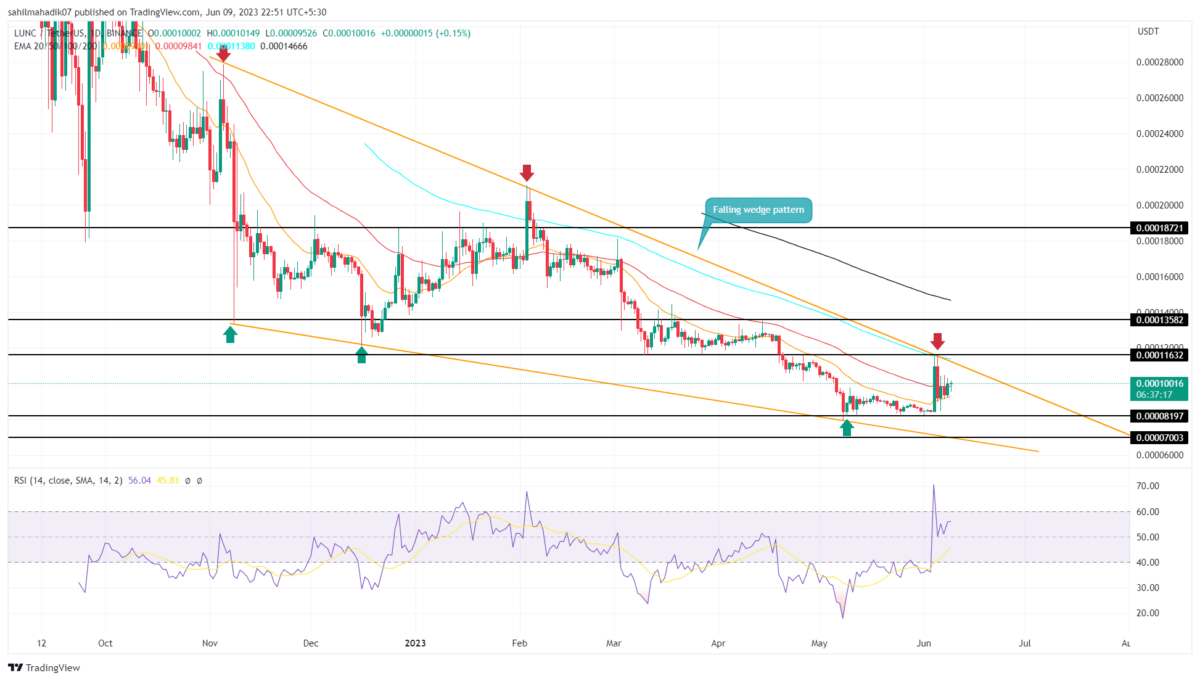
LUNC Price Daily Chart
- Despite the market sentiment remaining volatile, the LUNC price has respected the converging trendline of the wedge pattern
- A bearish reversal from the resistance trendline has set the coin price on a potential 26% drop
- The intraday trading volume in the LUNC coin is $82 Million, indicating a 27% gain.
 Source- Tradingview
On June 5th, the LUNC price turned down from the resistance trendline of the wedge pattern. This reversal triggers a bear cycle within the pattern and sets a significant downfall to the lower trendline.
By press time, the coin price trades at the $0.000098 mark and continues to walk sideways, indicating no clear initiation from market participants. However, If the bearish momentum persists, a breakdown below the 20-day EMA could plunge the prices 25-30% to hit the lower trendline located near $0.000065.
Conversely, if the LUNC price rises higher, the buyers may rechallenge the overhead trendline. A breakout above the trendline will be a key signal to kickstart a new recovery rally.
Will LUNC Price Rise to $0.00012?
Under the influence of a falling wedge pattern, the LUNC price stays in a negative trend. The aforementioned reversal has set the coin price for a potential downfall, which may pull the price to the next significant support situated at $0.000082, $0.00007, followed by a lower trendline. Alternatively, the coin price only attains a recovery above the $0.00012 if the buyer breaks the above trendline.
Play 10,000+ Casino Games at BC Game with Ease
- Instant Deposits And Withdrawals
- Crypto Casino And Sports Betting
- Exclusive Bonuses And Rewards


Why Trust CoinGape
CoinGape has covered the cryptocurrency industry since 2017, aiming to provide informative insights Read more…to our readers. Our journal analysts bring years of experience in market analysis and blockchain technology to ensure factual accuracy and balanced reporting. By following our Editorial Policy, our writers verify every source, fact-check each story, rely on reputable sources, and attribute quotes and media correctly. We also follow a rigorous Review Methodology when evaluating exchanges and tools. From emerging blockchain projects and coin launches to industry events and technical developments, we cover all facets of the digital asset space with unwavering commitment to timely, relevant information.


- BestChange.com Triples Referral Rewards in Major Program Overhaul
- FUNToken Launches First Mobile Game “Bounce Helix” on Android
- Breaking: Citigroup Cuts Bitcoin and Ethereum Price Targets amid CLARITY Act Delays
- Breaking: Bitcoin Treasury Metaplanet Moves 4986 BTC, Stock Price Tanks 12%
- Ripple News: XRPL Breaks Records with 7.7M Users Amid XRP Price Rally
- Bitcoin Price Forecast: Will BTC Break $80k Ahead of Fed Decision Today?
- MSTR Stock Prediction as Strategy Makes Largest Bitcoin Purchase in 2026 and Analyst Targets BTC Price $100K
- Pi Network Price Prediction After Smart Contract and Second Migration Launch
- Pepe Coin Price Surges 20%- How High Can it Go in March?
- Is XRP Price Gearing Up For $2 Level As BTC Rebounds Above $74k?
- Cardano’s $0.50 Resistance- Can “Midnight” Alpha Defy the Fog of War?


