 Buy $GGs
Terra Classic Price Analysis: $LUNC Price Exhibits Coiling Pattern Before Potential Surge; Buy Now?


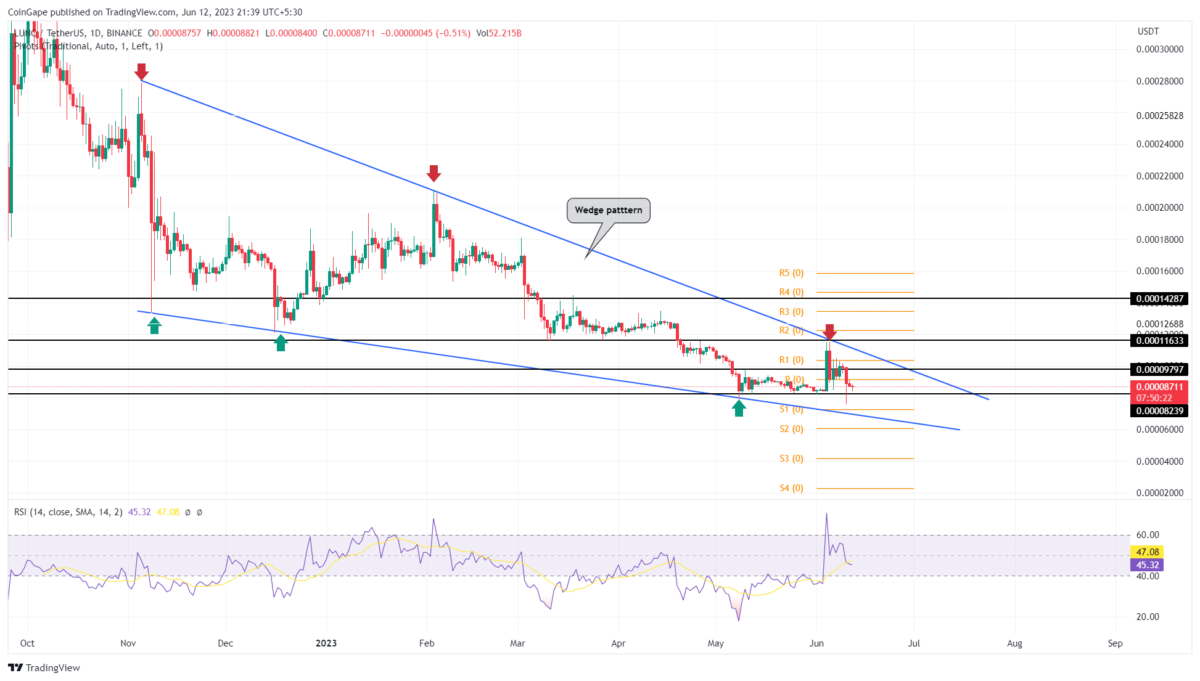
Terra Classic Price Analysis: The LUNC price showed a significant downturn last week, as the crypto market witnessed a heavy sell-off in altcoins. From the peak of $0.000115, the coin price tumbled nearly 24.5% to reach the current price of $0.000086. As the downsloping trendline is currently carrying this correction phase, the sellers could plunge the price back to the $0.00007 mark.
Also Read- Terra Luna Classic Staking Officially Hits 1 Trillion, LUNC Burn 63 Billion
LUNC Price Daily Chart
- The LUNC price is likely to witness high volatility in a narrow range.
- A breakdown below $0.000082 could tumble the prices by 15%.
- The intraday trading volume in the LUNC coin is $82 Million, indicating a 27% gain.
 Source- Tradingview
On June 10th, the LUNC price experienced a heavy sell-off and printed a long-red candle in the daily chart. This sell-off showed an attempt to break the local support of $0.000082 but the sellers failed to sustain lower levels.
Thus, the long-wick rejection candle validates the aforementioned level as a high accumulation zone, indicating the price is likely to fall below. Similarly, on the flip side, the overhead trendline will constantly pressurize the LUNC price and undermine bullish attempts.
Thus, the coin price is likely to coil between the mentioned until either of the levels is breached. Thus, the breakout will release the trapped momentum and trigger a direction move on the respected side.
Will LUNC Price Fall to $0.00007?
The near future trend for LUNC price depends on the range formation between the downsloping trendline and $0.000082 support. With the current market condition bearish, the LUNC price is likely to break below $0.000082 support which will intensify the selling pressure and push the coin to $0.00007. Conversely, a breakout above the overhead trendline will provide buyers with a suitable footing to lead the price to $0.0001.
- Pivot levels: This support/resistance indicator reflects the demand zone at $0.000073 and $0.00006, and on the flip side, it shows the supply zone at $0.000092 and $0.000103.
- Relative Strength Index: A bullish divergence in the daily RSI slope reflects increasing buying pressure at lower prices.
Play 10,000+ Casino Games at BC Game with Ease
- Instant Deposits And Withdrawals
- Crypto Casino And Sports Betting
- Exclusive Bonuses And Rewards


Why Trust CoinGape
CoinGape has covered the cryptocurrency industry since 2017, aiming to provide informative insights Read more…to our readers. Our journal analysts bring years of experience in market analysis and blockchain technology to ensure factual accuracy and balanced reporting. By following our Editorial Policy, our writers verify every source, fact-check each story, rely on reputable sources, and attribute quotes and media correctly. We also follow a rigorous Review Methodology when evaluating exchanges and tools. From emerging blockchain projects and coin launches to industry events and technical developments, we cover all facets of the digital asset space with unwavering commitment to timely, relevant information.

Related Articles


- Crypto Market Update: Top 3 Reasons Why BTC, ETH, XRP and ADA is Up
- Crypto News: Bitcoin Sell-Off Fears Rise as War Threatens Iran’s BTC Mining Operations
- U.S.–Iran War: Monday Crypto Crash Odds Rise As Pundits Predict Oil Price Spike
- US-Iran War: Reports Confirm Bombings In UAE, Bahrain and Kuwait As Crypto Market Makes Recovery
- XRP Price Dips on US-Iran Conflict, But Capitulation Signals March Rebound
- Bitcoin And XRP Price As US Kills Iran Supreme Leader- Is A Crypto Crash Ahead?
- Gold Price Prediction 2026: Analysts Expect Gold to Reach $6,300 This Year
- Circle (CRCL) Stock Price Prediction as Today is the CLARITY Act Deadline
- Analysts Predict Where XRP Price Could Close This Week – March 2026
- Top Analyst Predicts Pi Network Price Bottom, Flags Key Catalysts
- Will Ethereum Price Hold $1,900 Level After Five Weeks of $563M ETF Selling?


