 Buy $GGs
Terra Classic Price Analysis: Will $LUNC Price Break this Barrier For A 20% Jump?


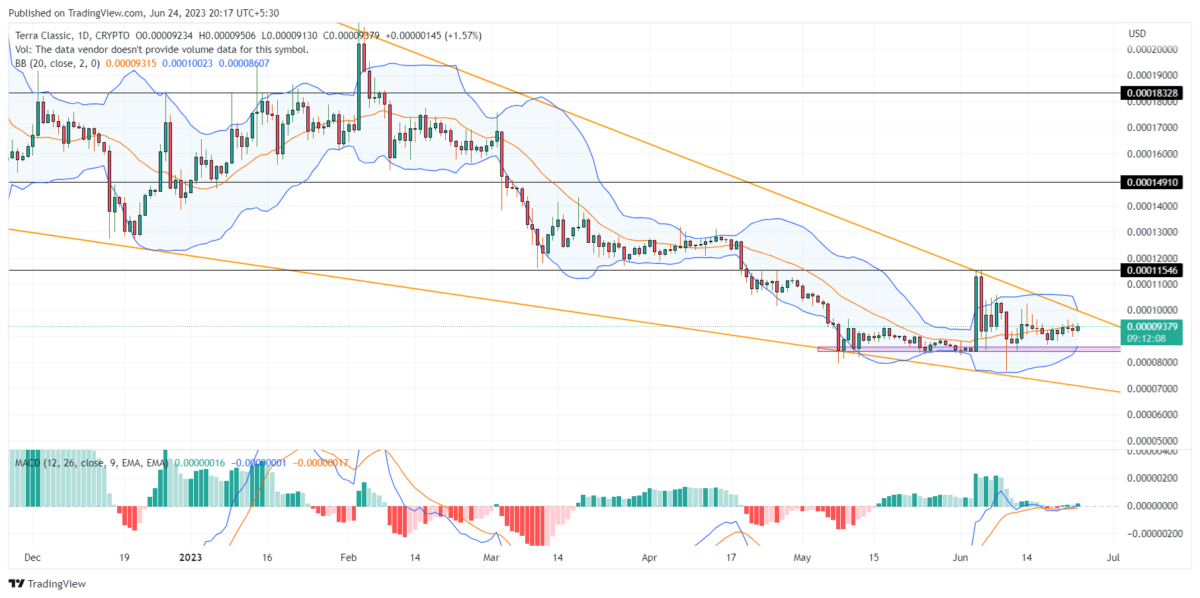
Terra Classic Price Analysis: Luna Classic is making the noise again in the crypto charts, with a 2.57% after long days of hibernation. LUNC prices jumping from the $0.000086 support zone displays a double-bottom reversal in the daily chart. The early-stage bull run seems ready to challenge the long-coming resistance trendline, so should you consider buying before the breakout?
Also read: LUNC News: Terra Classic Dev Teams Proceeds For USTC Repeg To Revive Price To $1
LUNC Price Daily Chart:
- The sudden jump in LUNC price projects a potential challenge to the resistance trendline.
- The retracing upper Bollinger band might challenge the breakout attempt.
- The intraday trading volume of the LUNC coin is $62 million, indicating an 8.83% gain.

(Source: Tradingview)
As of now, the LUNC price is trading at $0.00009434, showing a 2.29% gain for the day. The coin’s price has made an attempt to break out of a long-term trendline with a double-bottom reversal pattern.
The current growing bullish candle indicates an increase in bullish momentum after a period of sideways movement lasting 10 days. This suggests a prolonged buying phase that could potentially drive the price up by 5% to reach $0.0000994 and test the overhead resistance trendline.
To confirm the bullish sentiment, it’s important for the candle to maintain a closing price above the $0.000094 mark. The previous candle showed higher price rejection at this level, so sustaining above it would strengthen the underlying bullish sentiment and increase momentum toward reaching $0.000099.
Will the LUNC Price Surpass the $0.0001 Mark?
In the current recovering market, it’s most likely that the LUNC prices will challenge the resistance trendline of the triangle pattern. However, the chances of a breakout seem low. If a breakout does occur, it would provide buyers with a solid entry point. It’s worth noting that the upward trajectory could face another barrier near the next resistance level at $0.00011. A breakout above this level could propel LUNC by 20%.
- Moving Average Convergence/Divergence: A potential bullish crossover between the sideways moving signal and MACD line at zero line projects a buy signal.
- Bollinger Bands: The bands of Bollinger band indicators squeezed, accentuates the uncertainty in market sentiment and the need for a breakout to determine future movement.
Play 10,000+ Casino Games at BC Game with Ease
- Instant Deposits And Withdrawals
- Crypto Casino And Sports Betting
- Exclusive Bonuses And Rewards


Why Trust CoinGape
CoinGape has covered the cryptocurrency industry since 2017, aiming to provide informative insights Read more…to our readers. Our journal analysts bring years of experience in market analysis and blockchain technology to ensure factual accuracy and balanced reporting. By following our Editorial Policy, our writers verify every source, fact-check each story, rely on reputable sources, and attribute quotes and media correctly. We also follow a rigorous Review Methodology when evaluating exchanges and tools. From emerging blockchain projects and coin launches to industry events and technical developments, we cover all facets of the digital asset space with unwavering commitment to timely, relevant information.

Related Articles


- US-Iran War: Reports Confirm Bombings In UAE, Bahrain and Kuwait As Crypto Market Makes Recovery
- XRP Price Dips on US-Iran Conflict, But Capitulation Signals March Rebound
- Crypto Market at Risk as U.S.–Iran War Threatens Inflation With Oil Price Surge
- Polymarket U.S.–Iran Strike Bets Fuel Insider Trading Speculation as Crypto Traders Net $1.2M
- Cardano’s DeFi TVL Climbs as USDCx Stablecoin Launches on Network
- Circle (CRCL) Stock Price Prediction as Today is the CLARITY Act Deadline
- Analysts Predict Where XRP Price Could Close This Week – March 2026
- Top Analyst Predicts Pi Network Price Bottom, Flags Key Catalysts
- Will Ethereum Price Hold $1,900 Level After Five Weeks of $563M ETF Selling?
- Top 2 Price Predictions Ethereum and Solana Ahead of March 1 Clarity Act Stablecoin Deadline
- Pi Network Price Prediction Ahead of Protocol Upgrades Deadline on March 1


