 Buy $GGs
Terra Classic Price Prediction As LUNC Recoils Targeting 32% Move


Terra Classic Price Prediction: Terra Luna Classic like many other altcoins bowed down to immense selling pressure triggered after Binance CEO Changpeng Zhao’s resignation amid allegations of violating U.S. anti-money laundering laws. In the wake of a 25% dip to $0.000069, LUNC rebounded to trade at $0.00007389 on Thursday.
This recovery is expected to continue above $0.0001, however, resistance at $0.000077 and subsequently at $0.00008 as highlighted by the 200 Exponential Moving Average (EMA) on the hourly chart must be defeated. Moreover, a falling wedge pattern suggests the potential for a bullish comeback.
Also Read: Terra Luna Classic Community Passes Proposal For v2.3.0 Upgrade, LUNC Jumps
Terra Classic Price Prediction: Is $LUNC Heading to $0.00008
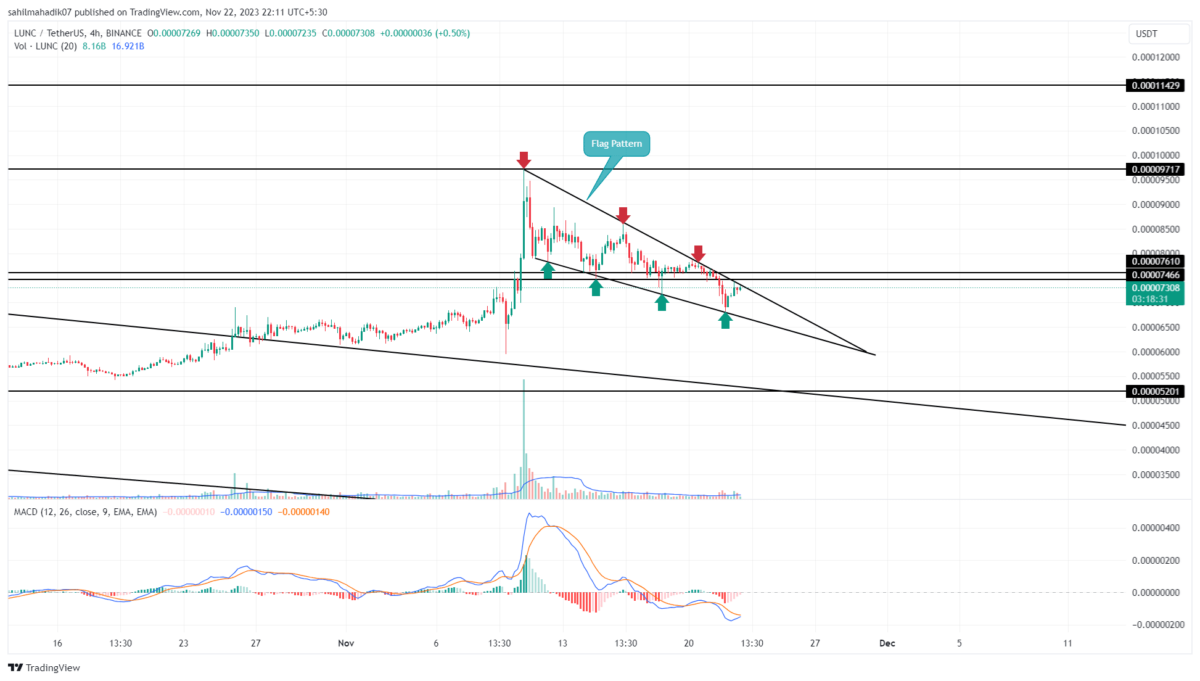
- Flag pattern formation may push recovery rally to $0.000079-$0.00008.
- The lower trendline of the flag prevents LUNC from a major downfall.
- The intraday trading volume in the LUNC coin is $35.5 Million, indicating a 47% gain.
 Source- Tradingview
The current correction in LUNC price came after a substantial recovery from mid-October to early November, hinting at the formation of a bullish flag pattern. This pattern suggests that the recent decline could be a temporary setback before a more substantial recovery.
Over the past two weeks, the coin price repeatedly bounced back from the lower trendline of this pattern, underscoring its significant impact on market sentiment. As of now, Terra classic coin trades at $0.0000726 and appears to be reversing from the upper trendline again.
The narrowing wedge pattern points towards an imminent breakout, with a high likelihood of breaching the upper trendline, providing a robust support base for continued bullish momentum.
Should this breakout occur, we could anticipate a potential surge of up to 32%, potentially revisiting the previous high of $0.000079.
LUNC vs BTC Performance
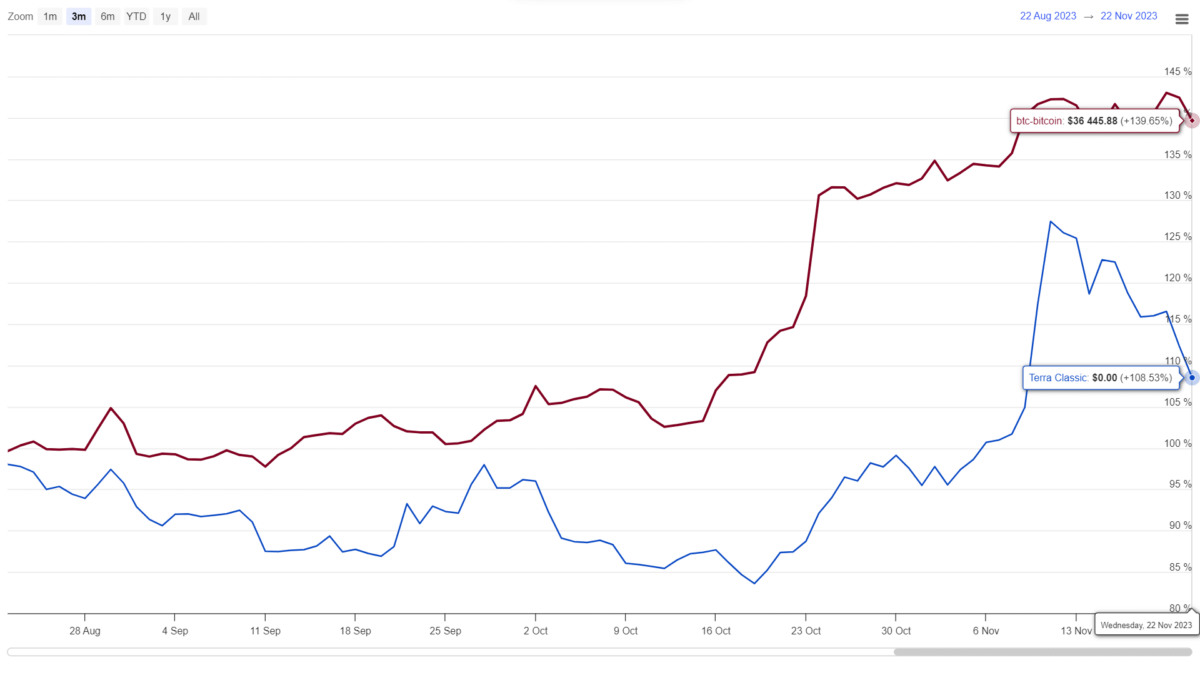 Source: Coingape| Terra Classic Vs Bitcoin Price
A three-month behavior of the LUNC Coin price alongside Bitcoin reveals that both benefited from the October-November rally. However, as market uncertainty prevails, the LUNC price has shown a significant downturn, indicating a weakening of bullish strength, especially in comparison to more stable Bitcoin price.
- Bollinger Bands: A downtick in the lower boundary of the Bollinger Band indicator reflects the selling momentum intact.
- Moving Average Convergence Divergence: The MACD and signal slope below the middle line indicate the sellers have an upper hand over the asset.
Play 10,000+ Casino Games at BC Game with Ease
- Instant Deposits And Withdrawals
- Crypto Casino And Sports Betting
- Exclusive Bonuses And Rewards


Why Trust CoinGape
CoinGape has covered the cryptocurrency industry since 2017, aiming to provide informative insights Read more…to our readers. Our journal analysts bring years of experience in market analysis and blockchain technology to ensure factual accuracy and balanced reporting. By following our Editorial Policy, our writers verify every source, fact-check each story, rely on reputable sources, and attribute quotes and media correctly. We also follow a rigorous Review Methodology when evaluating exchanges and tools. From emerging blockchain projects and coin launches to industry events and technical developments, we cover all facets of the digital asset space with unwavering commitment to timely, relevant information.
Terra Classic
24 Hours volume
$8.33M
Market Cap
$292.43M
Max Supply
NA

Related Articles


- Peter Schiff Predicts BTC to Fall, Gold to Rise as Markets Price in Prolonged Iran War
- Institutional Re-Accumulation Signs Emerge as Bitcoin ETFs See $1.1B Net Inflows Since Iran War Began: Glassnode
- From Mining Pool to Infrastructure Platform: Nine Years of EMCD
- U.S.-Iran War: U.S. Oil Prices Spike To One-Year High, Bitcoin and Gold Dip
- Crypto Traders Bet Against U.S.-Iran Ceasefire This Month as Iran Denies Peace Talks
- HOOD Stock Targets $100 as Robinhood Unveils Platinum Card and Advance Dividend Feature
- Bitcoin Price Prediction if Donald Trump Signs the CLARITY Act on April 3, 2026
- Pi Network Price As BTC Rallies Above $74K: Can PI Coin Extend Gains to $0.30?
- XRP Price As Bitcoin Reclaims $74K- Is $5 Next?
- Dogecoin Price Outlook as BTC Recovers Above $73,000
- XRP Price Prediction as Iran-U.S. Peace Talks Trigger a Crypto Rally


