 Buy $GGs
Terra Classic Price Dips to $0.000075; Best Time to Buy?


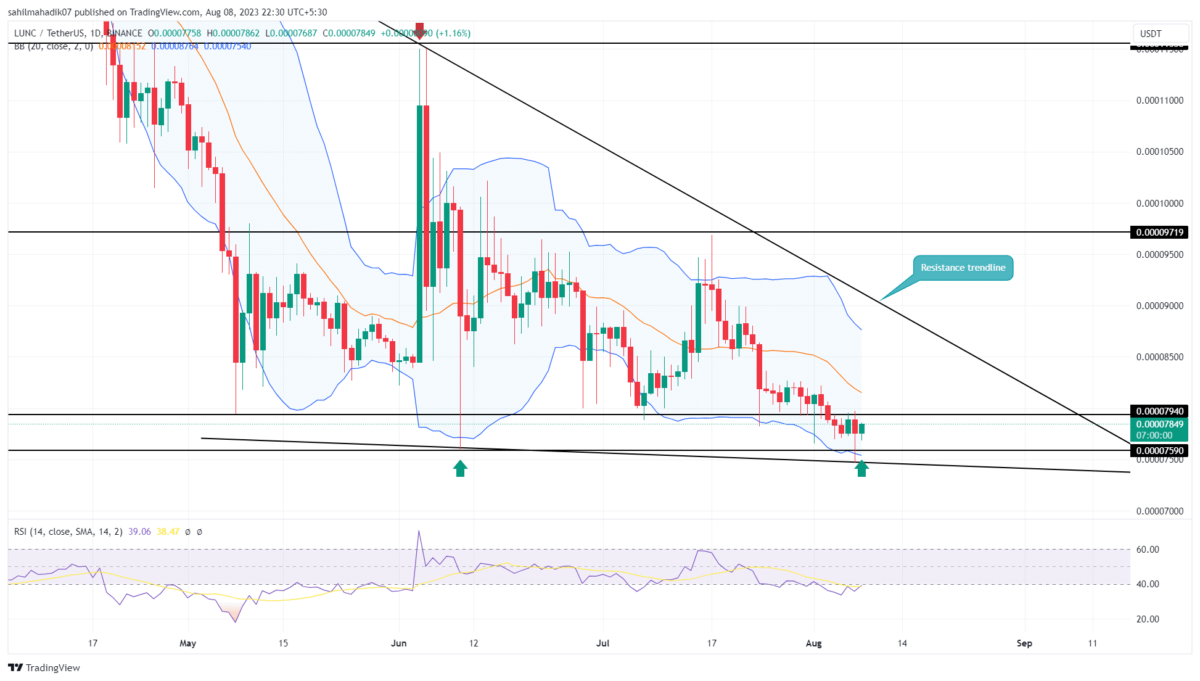
In response to the increasing bearishness in the crypto market, the Terra Classic price is gradually losing ground as it recently marked a yearly low of $0.0000746. On August 7th, the coin price showed a breakdown attempt from the June 10th low of $0.0000759, however, the buyers stepped immediately and reverted the price higher. This high-tail rejection is a sign of a high-demand zone. Can the LUNC price rebound from this support level?
Also Read: Fireblocks Situation Risks Binance And Other Exchanges To Delist Terra Luna Classic (LUNC)
Terra Classic Price Daily Chart
- The LUNC coin may remain in a downward trend until the overhead trendline is intact
- The bullish breakout from the $0.00008 resistance could set the LUNC price for a 10-12% upswing.
- The intraday trading volume in the LUNC coin is $17.8 Million, indicating an 8% loss.
 Source- Tradingview
On August 3rd, the Terra classic coin price gave a bearish breakdown from the horizontal support of $0.000075. However, the sellers failed to offer suitable follow-up leading to sideways action below the breached support.
As mentioned above the sellers tried to lower the LUNC coin’s market value on August 7th but the failure to do so indicates the presence of active buying. If the bullish momentum rises, the buyers could trigger a bullish upswing potentially raising the coin price 10-12% higher to hit the overhead trendline.
The market participants interested in this trade can wait for a bullish breakout above the high of the August 3rd candle($0.0000797) for better confirmation of price recovery.
LUNC Price Signals Trend Change?
Over the past five months, the Terra Classic price has been receiving dynamic resistance from a downsloping trendline. The coin price has already turned down thrice from this resistance indicating that traders are actively selling at this barrier. Therefore, the coin holders would need a breakout above this falling trendline to obtain a signal of a trend reversal
- Bollinger Band: The flattish lower band of the Bollinger Band indicator offers additional support to coin buyers.
- Relative Strength Index: Along with the anticipated $0.00008 breakout, the traders must check for the daily RSI slope rises above 40% to gain an extra confirmation of a bullish reversal.
Play 10,000+ Casino Games at BC Game with Ease
- Instant Deposits And Withdrawals
- Crypto Casino And Sports Betting
- Exclusive Bonuses And Rewards


Why Trust CoinGape
CoinGape has covered the cryptocurrency industry since 2017, aiming to provide informative insights Read more…to our readers. Our journal analysts bring years of experience in market analysis and blockchain technology to ensure factual accuracy and balanced reporting. By following our Editorial Policy, our writers verify every source, fact-check each story, rely on reputable sources, and attribute quotes and media correctly. We also follow a rigorous Review Methodology when evaluating exchanges and tools. From emerging blockchain projects and coin launches to industry events and technical developments, we cover all facets of the digital asset space with unwavering commitment to timely, relevant information.

Related Articles


- Meme Coin Market Dead? Top 5 Reasons Dogecoin, Shiba Inu, and Pepe Are Crashing
- Why Is Crypto Market Crashing Today (Feb 28)
- Breaking: Ethereum Price Drops Amid Israel-Iran Tensions; Machi Big Brother Liquidated Again
- CLARITY Act: Stablecoin Yield Debate Heats Up, but March 1 Deadline Not ‘Do or Die’
- Best Institutional Custody Solutions for Tokenized Assets in 2026
- Top Analyst Predicts Pi Network Price Bottom, Flags Key Catalysts
- Will Ethereum Price Hold $1,900 Level After Five Weeks of $563M ETF Selling?
- Top 2 Price Predictions Ethereum and Solana Ahead of March 1 Clarity Act Stablecoin Deadline
- Pi Network Price Prediction Ahead of Protocol Upgrades Deadline on March 1
- XRP Price Outlook As Jane Street Lawsuit Sparks Shift in Morning Sell-Off Trend
- Dogecoin, Cardano, and Chainlink Price Prediction As Crypto Market Rebounds


