Tezos Price Analysis: Faces Rejection Near $2.0; Is Upside Over?


Tezos price analysis suggests a probable correction in the price, provided some market conditions are met. The recent price action implies the extension of the higher highs and higher lows formation on the daily chart. However, the price met the upper projected target in today’s session.
Now, it would be interesting to watch if the price reverses or if the current upside remained intact.
The XTZ/USD pair is currently reading at a critical junction and a break of either the $2.05 resistance or the $1.80 support could set the further course of action. The coin is up by 14% and is exchanging hands at $1.90.
- Tezos price extends the gains on Wednesday with remarkable gains.
- The price retraced from the swing highs of $2.03 in the last few hours.
- Tezos trade in a rising channel on the daily chart, indicating the current upside trend.
XTZ price looks bullish
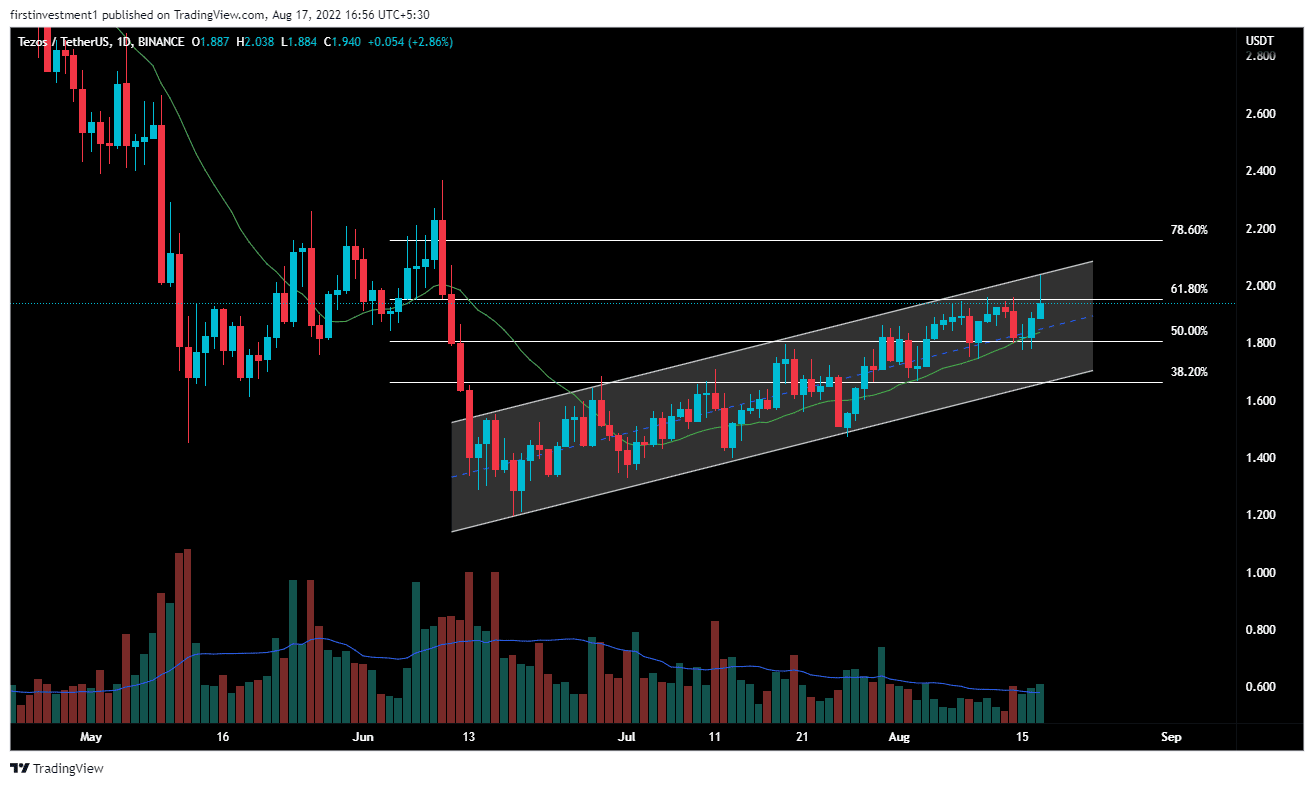
On the daily chart, the Tezos price analysis shows bulls meet a crucial resistance zone.
XTZ price is trading inside a rising channel, making higher highs and higher lows, but faces resistance near the higher levels around $1.930, which is also a 61.8% Fibonacci retracement level.
The price is near the highs of June 11. The volumes are below the average line and declining, with the price moving upwards, which implies worrisome. When the market is rising while volume is declining, the big money is not the one buying, more likely slowly exiting positions.
The daily chart shows that XTZ’s price faces a substantial resistance hurdle between $1.930 to $2.030.With every move on higher levels, volumes are dropping consecutively, indicating selling pressure on a higher level.
If the price breaks below $1.80, with good volumes then we can expect a good to bearish momentum up to the lows to $1.75.
On the other hand, additional buying pressure would be a pully in throwing the price toward the high of June 10 at $2.33.
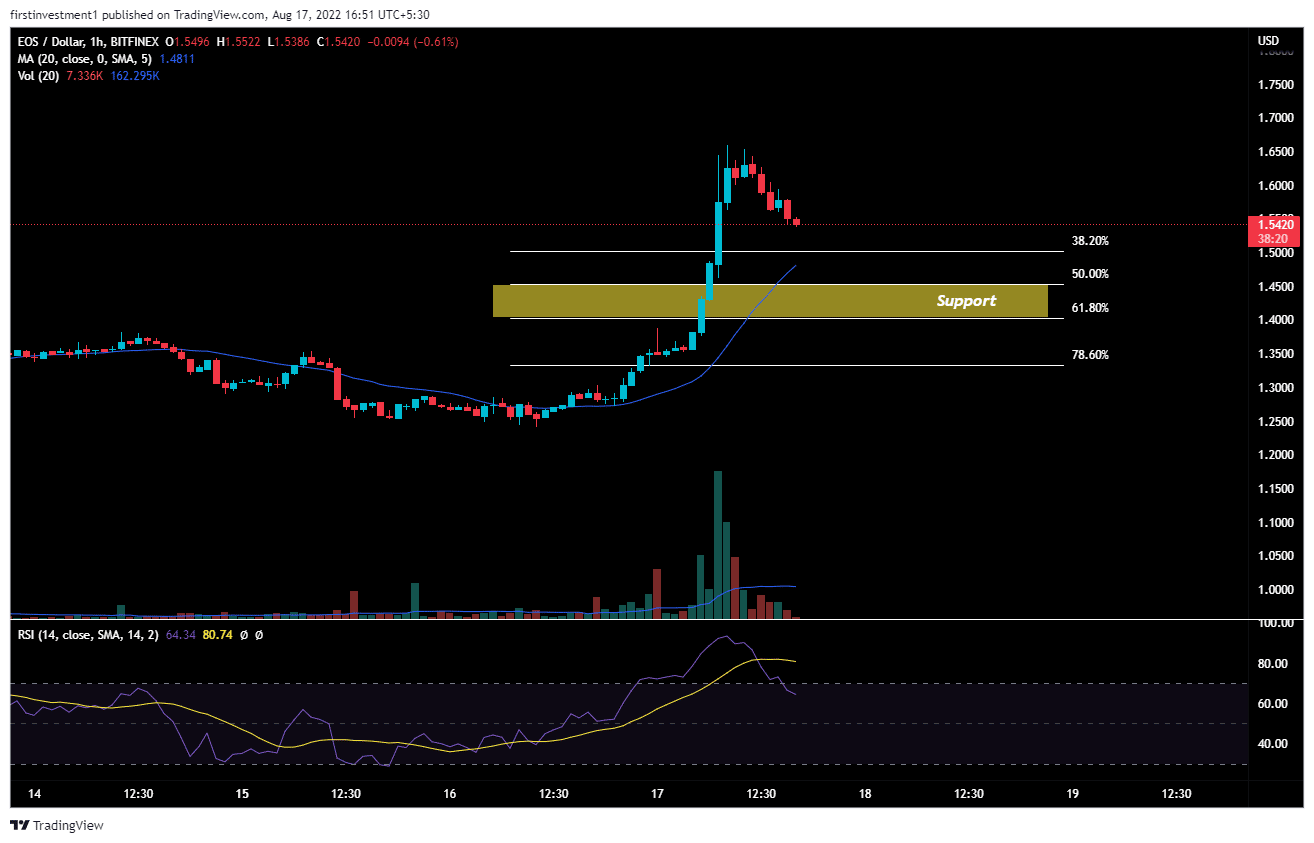
On the four-hourly time frame, the price gave a breakout of a Triple Top pattern by breaking its resistance level of $1.945. After giving the breakout, the price has just come for a retest of the supprot area.
There is a higher probability of the price would not be able to sustain and will start to fall down in the next couple of candles.
Also read: https://Just-In: The Merge Will Not Impact Gas Fees, Transaction Speed, ETH Staking
As shown in the charts, on August 15, the price was trading lower and formed a bearish candle, with a very big volume bar, implying big players are exiting from shorter positions.
The same pattern applied again on August 17, with the same big volume bar, implying big players are exiting long positions, by making false breakouts and trapping retail traders.
On the other hand, a break above the $2.040 level could invalidate the bearish outlook.
XTZ is slightly bearish on all time frames. Below $1.80, we can put a trade on the sell side.

Why Trust CoinGape
CoinGape has covered the cryptocurrency industry since 2017, aiming to provide informative insights Read more…to our readers. Our journal analysts bring years of experience in market analysis and blockchain technology to ensure factual accuracy and balanced reporting. By following our Editorial Policy, our writers verify every source, fact-check each story, rely on reputable sources, and attribute quotes and media correctly. We also follow a rigorous Review Methodology when evaluating exchanges and tools. From emerging blockchain projects and coin launches to industry events and technical developments, we cover all facets of the digital asset space with unwavering commitment to timely, relevant information.

Related Articles


- Aave Crosses $1B in RWAs as Capital Rotates From DeFi to Tokenized Assets
- Will Bitcoin, ETH, XRP, Solana Rebound to Max Pain Price amid Short Liquidations Today?
- 3 Top Reasons XRP Price Will Skyrocket by End of Feb 2026
- Metaplanet CEO Simon Gerovich Defends Bitcoin Strategy Amid Anonymous Allegations
- “Sell Bitcoin Now,” Peter Schiff Projects Further BTC Price Crash to $20k
- Bitcoin and XRP Price Prediction As White House Sets March 1st Deadline to Advance Clarity Act
- Top 3 Price Predictions Feb 2026 for Solana, Bitcoin, Pi Network as Odds of Trump Attacking Iran Rise
- Cardano Price Prediction Feb 2026 as Coinbase Accepts ADA as Loan Collateral
- Ripple Prediction: Will Arizona XRP Reserve Boost Price?
- Dogecoin Price Eyes Recovery Above $0.15 as Coinbase Expands Crypto-Backed Loans
- BMNR Stock Outlook: BitMine Price Eyes Rebound Amid ARK Invest, BlackRock, Morgan Stanley Buying


