Tezos Price Analysis: Will XTZ Reverses From $1.85 Mark?


Tezos price analysis indicates receding bullish momentum from the higher level placed near $1.85. The level formed a multiple resistance barricade for the buyers and poses challenges here. A new batch of buyers would be able to breach the mentioned level and would take the next level toward $2.0. Vital support could be found near $1.74, a level that must be held by the buyers to sustain the uptrend.
- Tezos price looks exhausted near the higher levels.
- A strong resistance zone around $1.85 pauses gains in the coin.
- A dip buying opportunity as the momentum oscillators remain bullish.
As of publication time, XTZ/USD is trading at $1.74, down 0.02% for the day. The 24-hour trading volume drops marginally to $59,558,898 according to CoinMarketCap data.
XTZ price extends consolidation
XTZ price is trading in a rising channel, making higher highs and higher lows, but faces rejection near the higher levels around $1.845.This level is near the highs of June 11. The volumes are also below average indicating that the price might ignore any bullish sentiment as of now.
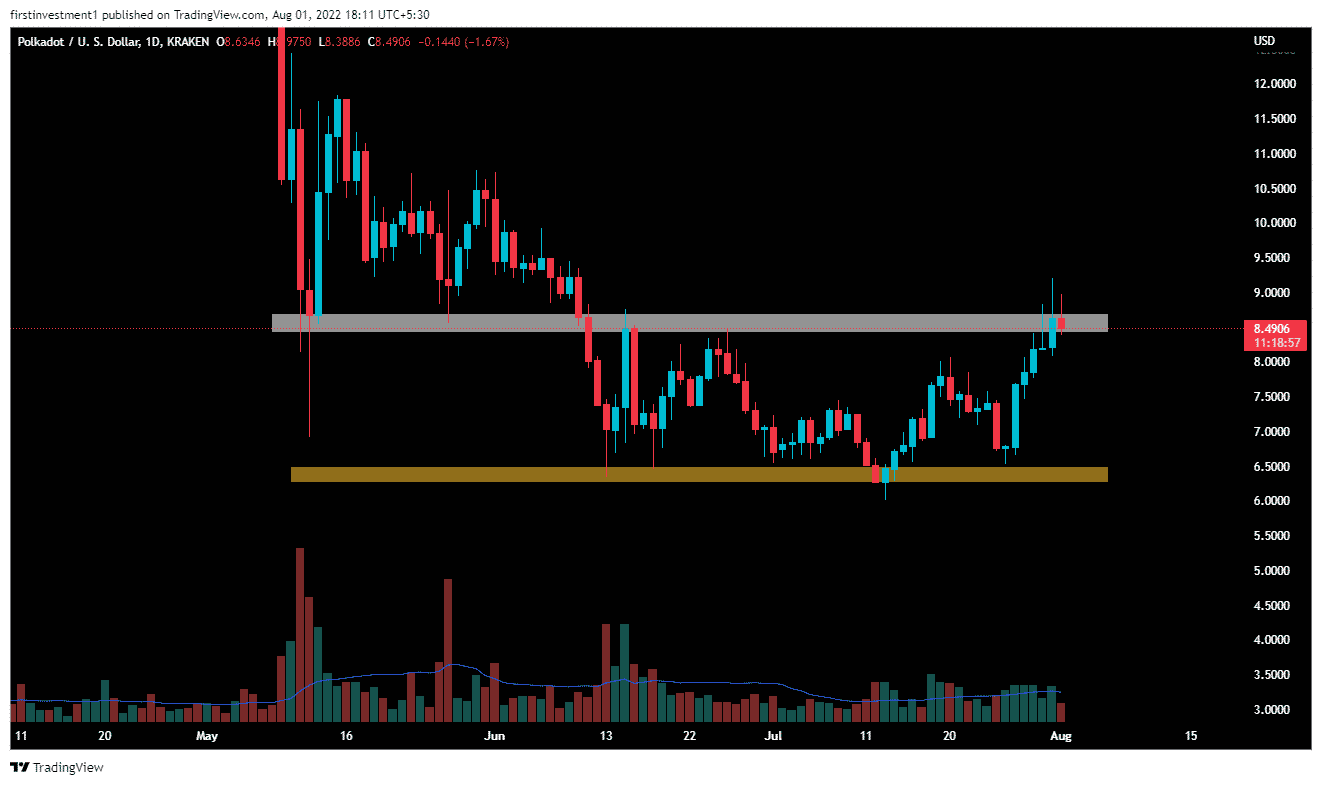
The daily chart shows that XTZ’s price faces a substantial resistance hurdle of around $1.845.The price is trading in a rising “ Channel Pattern” forming higher highs and higher lows on daily basis. But, with every move on higher levels, volumes are dropping consecutively, indicating selling pressure on higher levels.
A sustained buying pressure would channel the trend in favor of bulls. A daily close above $1.85 would open the gates for the psychological $2.0.
On the other hand, if the price breaks below $1.74, with good volumes then we can expect a good to bearish momentum up to the lows from $1.66 to 1.62.

On the hourly time frame, DOT is forming a ‘Head & Shoulder’ pattern, indicating bearishness. According to this pattern, an expected fall up to $1.66 could be possible.
The $1.73 level is the strong support of XTZ, due to the “Triple Top Pattern”, going on with bearish H&S, along with a rising trendline connecting to this above-given level.
On the other hand, a break above the $1.85 level could invalidate the bearish outlook.

Why Trust CoinGape
CoinGape has covered the cryptocurrency industry since 2017, aiming to provide informative insights Read more…to our readers. Our journal analysts bring years of experience in market analysis and blockchain technology to ensure factual accuracy and balanced reporting. By following our Editorial Policy, our writers verify every source, fact-check each story, rely on reputable sources, and attribute quotes and media correctly. We also follow a rigorous Review Methodology when evaluating exchanges and tools. From emerging blockchain projects and coin launches to industry events and technical developments, we cover all facets of the digital asset space with unwavering commitment to timely, relevant information.