Tezos Price Analysis: XTZ Fell 23% This Week; What’s Next?


Tezos price analysis indicates a corrective pullback. XTZ price has been in the short-term uptrend till August 17. After forming a double top near $2.06, the pair retraced lower and fell 23%.
As of press time, XTZ/USD is trading at $1.06, up 1.74% for the day. The 24-hour trading volume of the coin fell more than 36% to $38,417,085 according to CoinMarketCap.
- Tezos price managed to trade higher with minute gains.
- However, the price fell more than 23% in the week.
- A daily candlestick below $1.60 will bring more losses.
Tezos price trades with caution
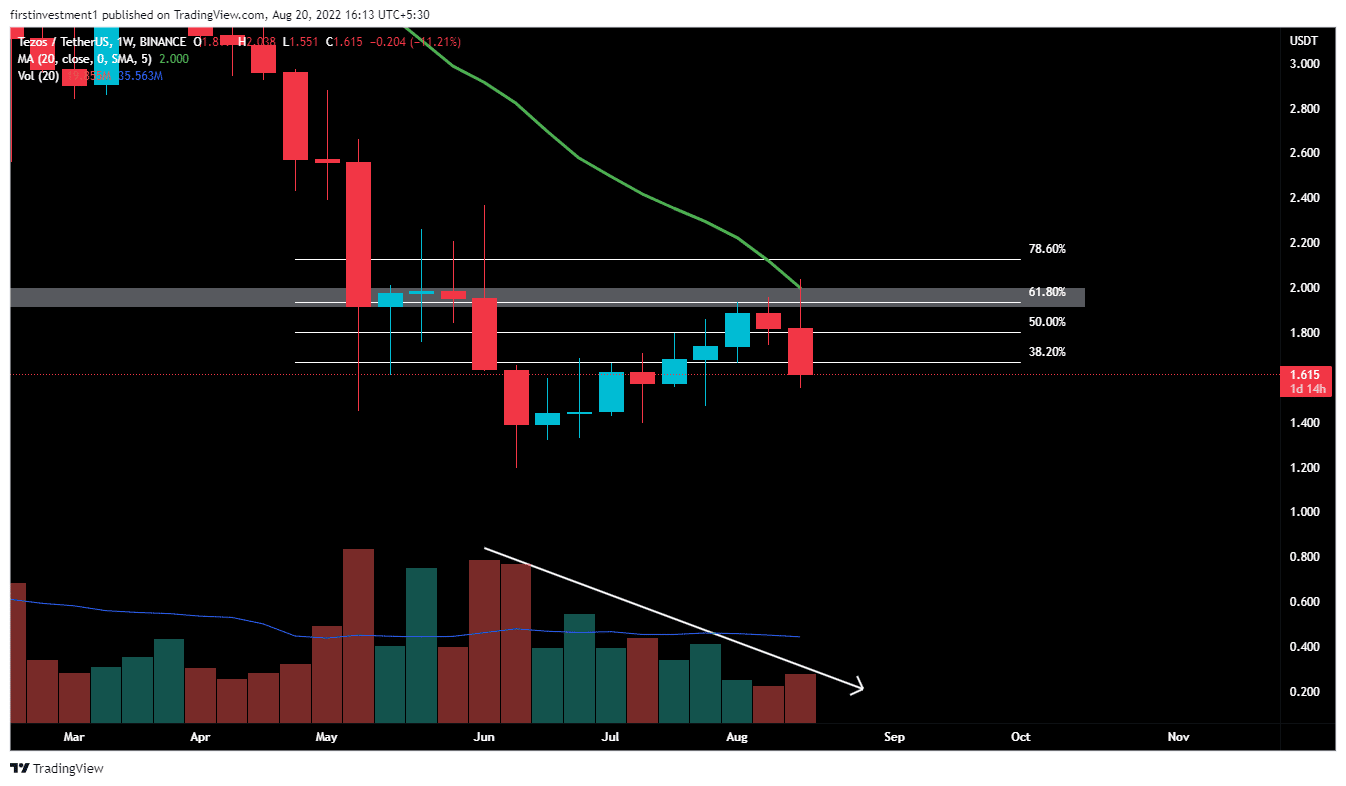
On the weekly chart, after testing the low of $2.10, the price had made a high of $9.2. The price recorded an upside of more than 350%.
However, on May 16, 2022, the price broke the support of nearly two years of $2.0 and gave a closing below this level on the weekly chart, & then started to fall toward $1.22.
This week, the price tested the $2.0 level once again, but couldn’t sustain the gains. The bull faces heavy selling pressure near the level, which was once acting as a support.
The price is taking resistance of the 20-day exponential moving average. Along with a 61.8% Fibonacci retracement, which will act as immediate resistance for this week.
Now, if the price on the weekly chart, closes below $1.50, then there is a high probability of the price going up to its recent swing low, which is between $1.2 to $1.4.
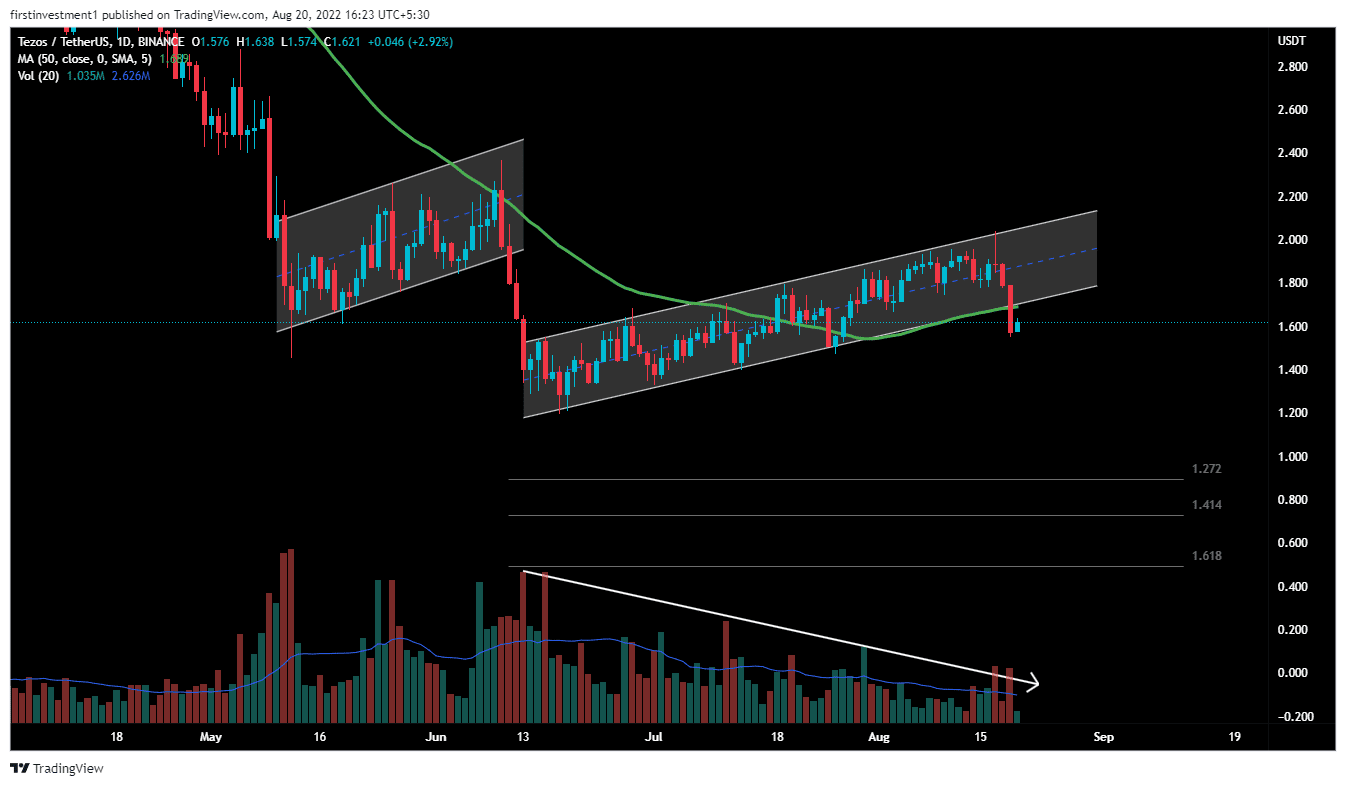
On the daily chart, the XTZ recently gave a breakdown of a bearish “Flag & pole” pattern, indicating weakness around the overall look, along with a clear break of the 50-day exponential moving average.
XTZ’s price broke the pattern’s support level and gave a bearish breakdown. The volumes were declining, with the rising price of an XTZ, which implies a worry for the bulls. When the market is rising while volume is declining, big money is not the one buying, more likely slowly exiting positions.
Also read: https://Crypto Market Plummets, Will The Hawkish Fed Create New Lows
According to this pattern, The expected fall in XTZ price could fall up to $1.33. To find targets for Flag Pattern, the Fibonacci Extension indicator is used, which gives us more than 70% accurate targets.
The nearest support is the swing low, which is $1.51, whereas the nearest resistance could be found at $1.70. There is a higher probability of the price breaking the support level. “Sell on rising” opportunity is the best course of plan we can go with.
On the other hand, a sustained buying pressure above the $1.72 level could invalidate the bearish outlook. And the price can move toward $1.90.
XTZ looks bearish on all time frames. Below $1.55 closing on the daily time frame, we can put a trade on the sell side.

Why Trust CoinGape
CoinGape has covered the cryptocurrency industry since 2017, aiming to provide informative insights Read more…to our readers. Our journal analysts bring years of experience in market analysis and blockchain technology to ensure factual accuracy and balanced reporting. By following our Editorial Policy, our writers verify every source, fact-check each story, rely on reputable sources, and attribute quotes and media correctly. We also follow a rigorous Review Methodology when evaluating exchanges and tools. From emerging blockchain projects and coin launches to industry events and technical developments, we cover all facets of the digital asset space with unwavering commitment to timely, relevant information.

Related Articles


- Prediction Market News: Kalshi Faces New Lawsuit Amid State Regulatory Crackdown
- Will Bitcoin Crash To $58k or Rally to $75k After Hot PCE Inflation Data?
- Ripple’s RLUSD Gets Institutional Boost as SEC Eases Stablecoin Rules for Broker-Dealers
- Crypto Market Weekly Recap: BTC Waver on Macro & Quantum Jitters, CLARITY Act Deadline Fuels Hope, Sui ETFs Go Live Feb 16-20
- Robert Kiyosaki Adds To Bitcoin Position Despite Market Decline
- XRP Price Prediction As SBI Introduces Tokenized Bonds With Crypto Rewards
- Ethereum Price Rises After SCOTUS Ruling: Here’s Why a Drop to $1,500 is Possible
- Will Pi Network Price See a Surge After the Mainnet Launch Anniversary?
- Bitcoin and XRP Price Prediction As White House Sets March 1st Deadline to Advance Clarity Act
- Top 3 Price Predictions Feb 2026 for Solana, Bitcoin, Pi Network as Odds of Trump Attacking Iran Rise
- Cardano Price Prediction Feb 2026 as Coinbase Accepts ADA as Loan Collateral


