 Buy $GGs
This Chart Pattern May Encourage Stellar Price To Outperform Bitcoin


While the crypto market is still struggling with uncertainty, the XLM buyers show their commitment with a bullish breakout from the descending triangle pattern. Completing this pattern should bring a strong directional rally for coin holders. However, the $0.13 mark remains a formidable barrier to Stellar price recovery,
Key points:
- A 20-and-100-day EMA nearing a bullish crossover could accelerate the ongoing bull run
- A bullish breakout from $0.13 is needed to confirm the Stellar price recovery
- The intraday trading volume in the XLM is $270.5 Million, indicating a 137% gain.
 Source- digitalcoinprice
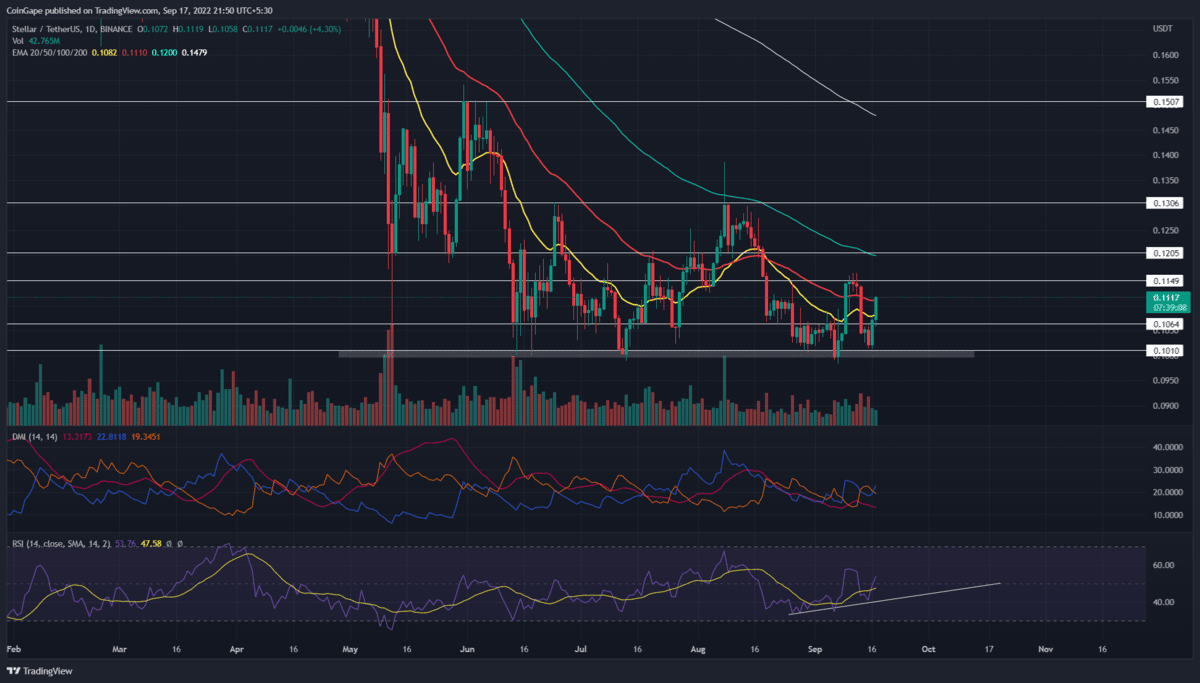
The Stellar price has followed a descending triangle pattern for the past four months. The altcoin has tested the pattern’s downsloping trendline and the $0.1 neckline support multiple times indicates the traders are actively responding to these levels.
Though this price pattern encourages the continuation of the prevailing downtrend once the prices break the support neckline. However, in rare cases, the price may invalidate this bearish if the buyers could breach the overhead trendline.
Despite the recent sell-off in the crypto market with the release of US unemployment data, the Stellar price managed a steady recovery. Backed by rising volume activity, altcoin gave a bullish breakout from the overhead trendline.
This breakout indicates a switch in market sentiment from selling on rallies to buying on dips. This development should offer suitable footing for buyers to extend the ongoing recovery. As per the technical setup, the Stellar price rally should drive the altcoin 20% high to $0.15.
However, the coin buyers could face strong resistance at the $0.13 mark, as it has limited bullish growth room for the past three months. Thus, the safe traders can enter once the gives daily candle closes above $0.13.
Technical Indicator
Bollinger band: the Stellar prices hitting the upper band suggests the buying activity has exceeded the normal price range. This indicator’s trendline should encourage it to consolidate above the $0.15 resistance.
RSI: the daily-RSI slope reflecting a similar growth-like price action indicates the market sentiment supports a bullish recovery.
Stellar Price Intraday Levels
- Spot rate: $0.125
- Trend: Bullish
- Volatility: High
- Resistance level: $0.13 and $1.15
- Support levels: $0.113 and $0.1
Play 10,000+ Casino Games at BC Game with Ease
- Instant Deposits And Withdrawals
- Crypto Casino And Sports Betting
- Exclusive Bonuses And Rewards


Why Trust CoinGape
CoinGape has covered the cryptocurrency industry since 2017, aiming to provide informative insights Read more…to our readers. Our journal analysts bring years of experience in market analysis and blockchain technology to ensure factual accuracy and balanced reporting. By following our Editorial Policy, our writers verify every source, fact-check each story, rely on reputable sources, and attribute quotes and media correctly. We also follow a rigorous Review Methodology when evaluating exchanges and tools. From emerging blockchain projects and coin launches to industry events and technical developments, we cover all facets of the digital asset space with unwavering commitment to timely, relevant information.

Related Articles


- “There Is Only One Gold,” Billionaire Ray Dalio Says Amid BTC’s Quantum Threats
- Goldman Sachs CEO Predicts ‘Weeks’ of Crypto Market Crash as U.S Iran War Continues
- Polymarket Axes ‘Nuclear Detonation’ Prediction Market Amid Public Fury
- Indiana Signs Bitcoin Bill Into Law Allowing Crypto in Retirement Plans
- ‘Time to Act Is Now’: CFTC Chief Pushes Swift Passage of CLARITY Act
- Bitcoin Price At Risk? Professor Who Predicted US-Iran War Says America Could Lose
- Gold Price Prediction March 2026: Rally, Crash, or Record Highs?
- RIOT Stock Prediction as Needham, Piper Sandler Slash Target After Earnings
- Cardano Price Outlook As Charles Hoskinson Warns Over CLARITY Act
- Circle Stock Price Climbs 15% to $96, Can Rally Continue in March 2026?
- Bitcoin Price Prediction as US-Iran War Enters 4th Consecutive Day


