This Coin Skyrocketed By 200% Over Last Week; Shall You Buy?


UMA, the native token of the Universal Market Access Protocol, has garnered significant attention from cryptocurrency investors, particularly due to its impressive performance in a market fraught with uncertainty. Over the past four days, the UMA price has skyrocketed by 212%, achieving a remarkable 20-month peak at $6.73. This surge represents a decisive breakout from a prolonged period of accumulation, marking the emergence of a bullish reversal trend that could pave the way for sustained future growth.
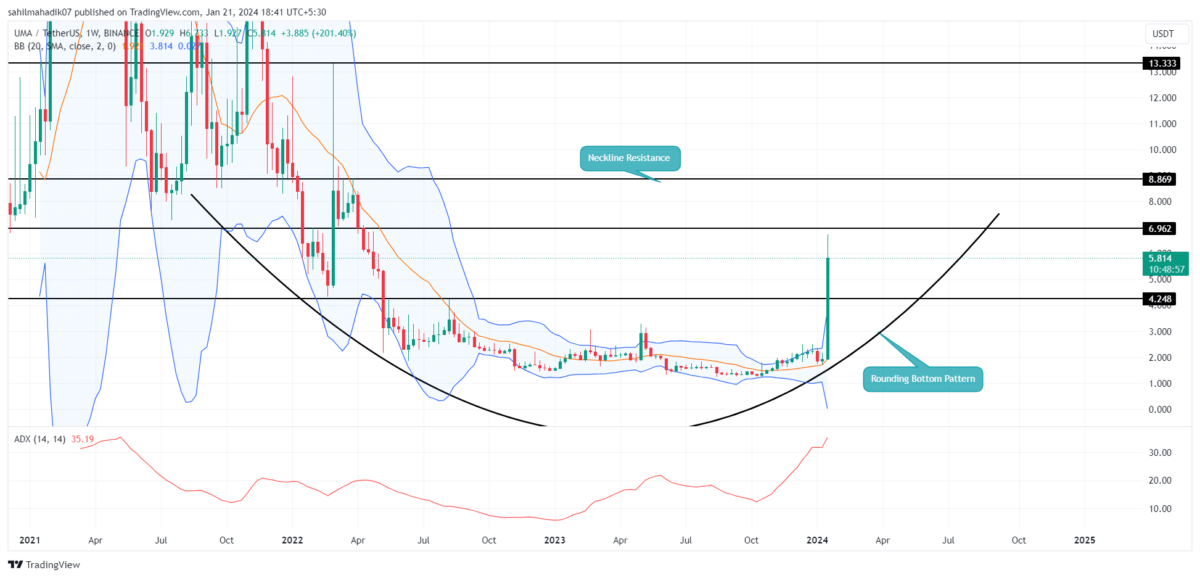
UMA Price Escape From Accumulation Trend Hints New Rally Ahead
- A rounding bottom pattern governs the current recovery trend in UMA price.
- A rising price may face overhead supply at $6.92, followed by $8.87 and $13.3
- The intraday trading volume in UMA is $553.7 Million, indicating a 33% loss.

For the past 20 months, the UMA Price had been largely trading in a lateral movement, struggling to maintain its value above the key resistance level of $4.25. However, this scenario changed dramatically earlier this week when altcoin experienced a substantial influx of investment. This surge led to a remarkable escalation in its price, soaring from $1.92 to $5.98 – a staggering 210% growth within a week.
This rally could be attributed to the upcoming launch of ‘Oval’- a crypto solution that, UMA is launching around next week that will elegantly reclaim >$100m of free money lost each year to MEV(Maximal extractable value)- stated by UMA Co-founder Hart Lambur in an X Post.
Coinciding with these developments, the Total Value Secured (TVS) in UMA also experienced a significant boost, reaching a new All-Time High of $775 million.

On January 19th, the UMA price gave a decisive breakout from the $4.25 resistance, which indicates the buyers escaped from a 20-month-long accumulation. Followed by a retest candle, the coin price is 25% up today projecting its suitability for high growth.
Bullish Reversal Pattern Hints Bottom Formation
A look at the daily time frame chart shows the current recovery in UMA price is developing into a rounding bottom pattern. The chart set often indicates the bottom formation of an asset and promotes gradual accumulation from traders to lead to a new recovery. If this buying momentum continues, the UMA price may present a new entry opportunity with a potential breakout above the $6.92 resistance level.
Under the influence of this pattern, the UMA price is likely to chase $13.37 neckline resistance, accounting for 128% potential growth.
- Bollinger Band: A coin price challenging the upper boundary of the Bollinger Band indicator accentuates the buyers’ aggressiveness.
- Average Direction Index: The high value of ADX(35) reflects the ongoing rally may soon hit exhaustion and trigger a minor pullback to sustain its growth.
Related Articles:
- Bitcoin’s Maintains Lukewarm Performance Amid S&P 500 Record High
- Crypto Headlines of the Week: Bitcoin ETFs Advance, Binance & Terra Propel Speculations
- Crypto Price Prediction For Jan 21: Ethereum (ETH), Solana (SOL), Luna Classic (LUNC)

Why Trust CoinGape
CoinGape has covered the cryptocurrency industry since 2017, aiming to provide informative insights Read more…to our readers. Our journal analysts bring years of experience in market analysis and blockchain technology to ensure factual accuracy and balanced reporting. By following our Editorial Policy, our writers verify every source, fact-check each story, rely on reputable sources, and attribute quotes and media correctly. We also follow a rigorous Review Methodology when evaluating exchanges and tools. From emerging blockchain projects and coin launches to industry events and technical developments, we cover all facets of the digital asset space with unwavering commitment to timely, relevant information.

Related Articles


- XRP News: Ripple Partner SBI Reveals On-Chain Bonds That Pay Investors in XRP
- BitMine Ethereum Purchase: Tom Lee Doubles Down on ETH With $34.7M Fresh Buy
- BlackRock Buys $65M in Bitcoin as U.S. Crypto Bill Odds Passage Surge
- Bitcoin Sell-Off Ahead? Garett Jin Moves $760M BTC to Binance Amid Trump’s New Tariffs
- CLARITY Act: Trump’s Crypto Adviser Says Stablecoin Yield Deal Is “Close” as March 1 Deadline Looms
- Ethereum Price Rises After SCOTUS Ruling: Here’s Why a Drop to $1,500 is Possible
- Will Pi Network Price See a Surge After the Mainnet Launch Anniversary?
- Bitcoin and XRP Price Prediction As White House Sets March 1st Deadline to Advance Clarity Act
- Top 3 Price Predictions Feb 2026 for Solana, Bitcoin, Pi Network as Odds of Trump Attacking Iran Rise
- Cardano Price Prediction Feb 2026 as Coinbase Accepts ADA as Loan Collateral
- Ripple Prediction: Will Arizona XRP Reserve Boost Price?


