Time to Reclaim $0.00001? Shiba Inu Price Edging Closure to a Massive Breakout


While the top two cryptocurrencies, Bitcoin and Ethereum, continue to struggle in the correction phase, the Shiba Inu price holds to its recovery setup. At the time of writing, the Dog-theme memecoin is trading at $0.000008, marking a substantial 50% surge over the past seven weeks. In addition, the ascending triangle pattern which carries the current recovery cycle is still intact, indicating the buyers could reclaim even higher chart levels. Time to buy?
Also Read: Floki Inu, Shiba Inu, Tradecurve Show Signs Of Bullish Momentum: Time To Fill Your Pockets?
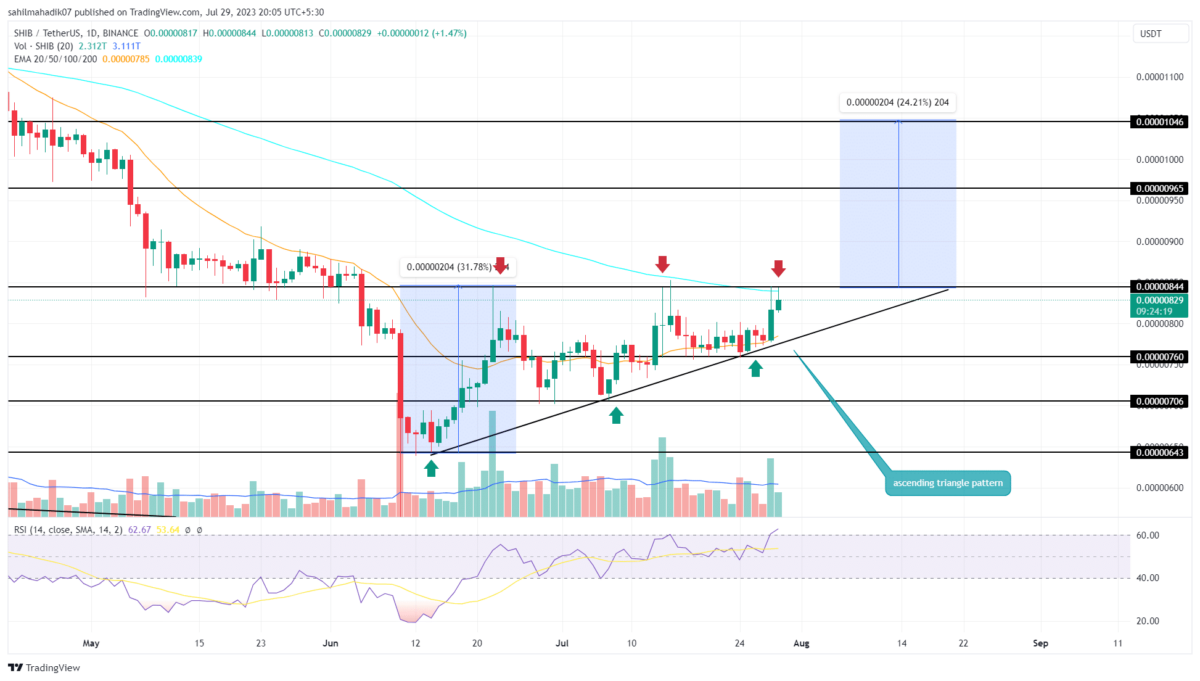
Shiba Inu Price Daily Chart:
- The daily chart demonstrates the significant influence of the triangle pattern as the coin price bounced back three times from both the $0.00000845 resistance level and the lower support trendline.
- A breakout above the $0.00000845 neckline will set the SHIB price for a 24% upswing.
- The intraday trading volume of the Shiba Inu coin is $89.2 Million, showing a 6.53% gain.
 Source- Tradingview
The daily time frame chart shows the Shiba Inu price is strictly responding to the formation of an ascending triangle pattern. On July 28, the coin price rebounded from the pattern’s support trendline with an 8.5% intraday gain but faced immediate resistance at $0.00000845.
The narrow space available between the triangle pattern indicates the SHIB price is close to a breakout opportunity. Under the influence of this bullish continuation pattern, crypto buyers are more likely to break the overhead neckline resistance.
A decisive breakout backed by sufficient volume will offer buyers a solid launchpad to rise higher. The post-breakout rally surged this memecoin 24% higher and reached the $0.0000105 ceiling.
Can SHIB Price Fall Back to $0.000007 Support?
Should the broader market sentiment persist in exerting downward pressure on the Shiba Inu price, the coin holders could witness a sideways above $0.0000084 or a breakdown below the support trendline. Such a downturn would counter the previously suggested bullish perspective and lead to a substantial drop. With sustained sell-off, the memecoin price could fall to prior support of $0.0000076 followed by $0.000007, or $0.0000064.
- Relatives Strength Index: The daily RSI slope surged above the 60% mark indicating the bullish momentum is aggressive.
- Exponential Moving Average: A potential bullish crossover between the 20-and-50-day EMAs would attract more buyers in the crypto market.

Why Trust CoinGape
CoinGape has covered the cryptocurrency industry since 2017, aiming to provide informative insights Read more…to our readers. Our journal analysts bring years of experience in market analysis and blockchain technology to ensure factual accuracy and balanced reporting. By following our Editorial Policy, our writers verify every source, fact-check each story, rely on reputable sources, and attribute quotes and media correctly. We also follow a rigorous Review Methodology when evaluating exchanges and tools. From emerging blockchain projects and coin launches to industry events and technical developments, we cover all facets of the digital asset space with unwavering commitment to timely, relevant information.

Related Articles


- Bitcoin Sell-Off Ahead? Garett Jin Moves $760M BTC to Binance Amid Trump’s New Tariffs
- CLARITY Act: Trump’s Crypto Adviser Says Stablecoin Yield Deal Is “Close” as March 1 Deadline Looms
- Trump Tariffs: U.S. To Impose 10% Global Tariff Following Supreme Court Ruling
- CryptoQuant Flags $54K Bitcoin Risk As Trump Considers Limited Strike On Iran
- Why Is Bitdeer Stock Price Dropping Today?
- Ethereum Price Rises After SCOTUS Ruling: Here’s Why a Drop to $1,500 is Possible
- Will Pi Network Price See a Surge After the Mainnet Launch Anniversary?
- Bitcoin and XRP Price Prediction As White House Sets March 1st Deadline to Advance Clarity Act
- Top 3 Price Predictions Feb 2026 for Solana, Bitcoin, Pi Network as Odds of Trump Attacking Iran Rise
- Cardano Price Prediction Feb 2026 as Coinbase Accepts ADA as Loan Collateral
- Ripple Prediction: Will Arizona XRP Reserve Boost Price?


