 Buy $GGs
Top 3 Predictions for Bitcoin price, Ethereum price and XRP price for 2026 According to Analysts


Highlights
- Bitcoin price structure supports a 2026 analyst target near $133K based on cycle symmetry.
- Ethereum price framework aligns with analyst projections toward $4,250 under sustained demand acceptance.
- XRP price breakout fractal underpins analyst expectations for a $15+ extension in 2026.
Bitcoin price, Ethereum price, and XRP price show renewed strength heading into 2026 after daily gains of 2.04%, 2.57%, and 1.45% respectively. BTC price establishes the overall mood, and Ethereum and XRP are the ones with different technical configurations. Structural breaks, demand zones, and historical fractals are the focus of analysts. The charts represent various stages of expansion risk of major assets.
Bitcoin Price Breakout Blueprint Signals Expansion Risk Ahead
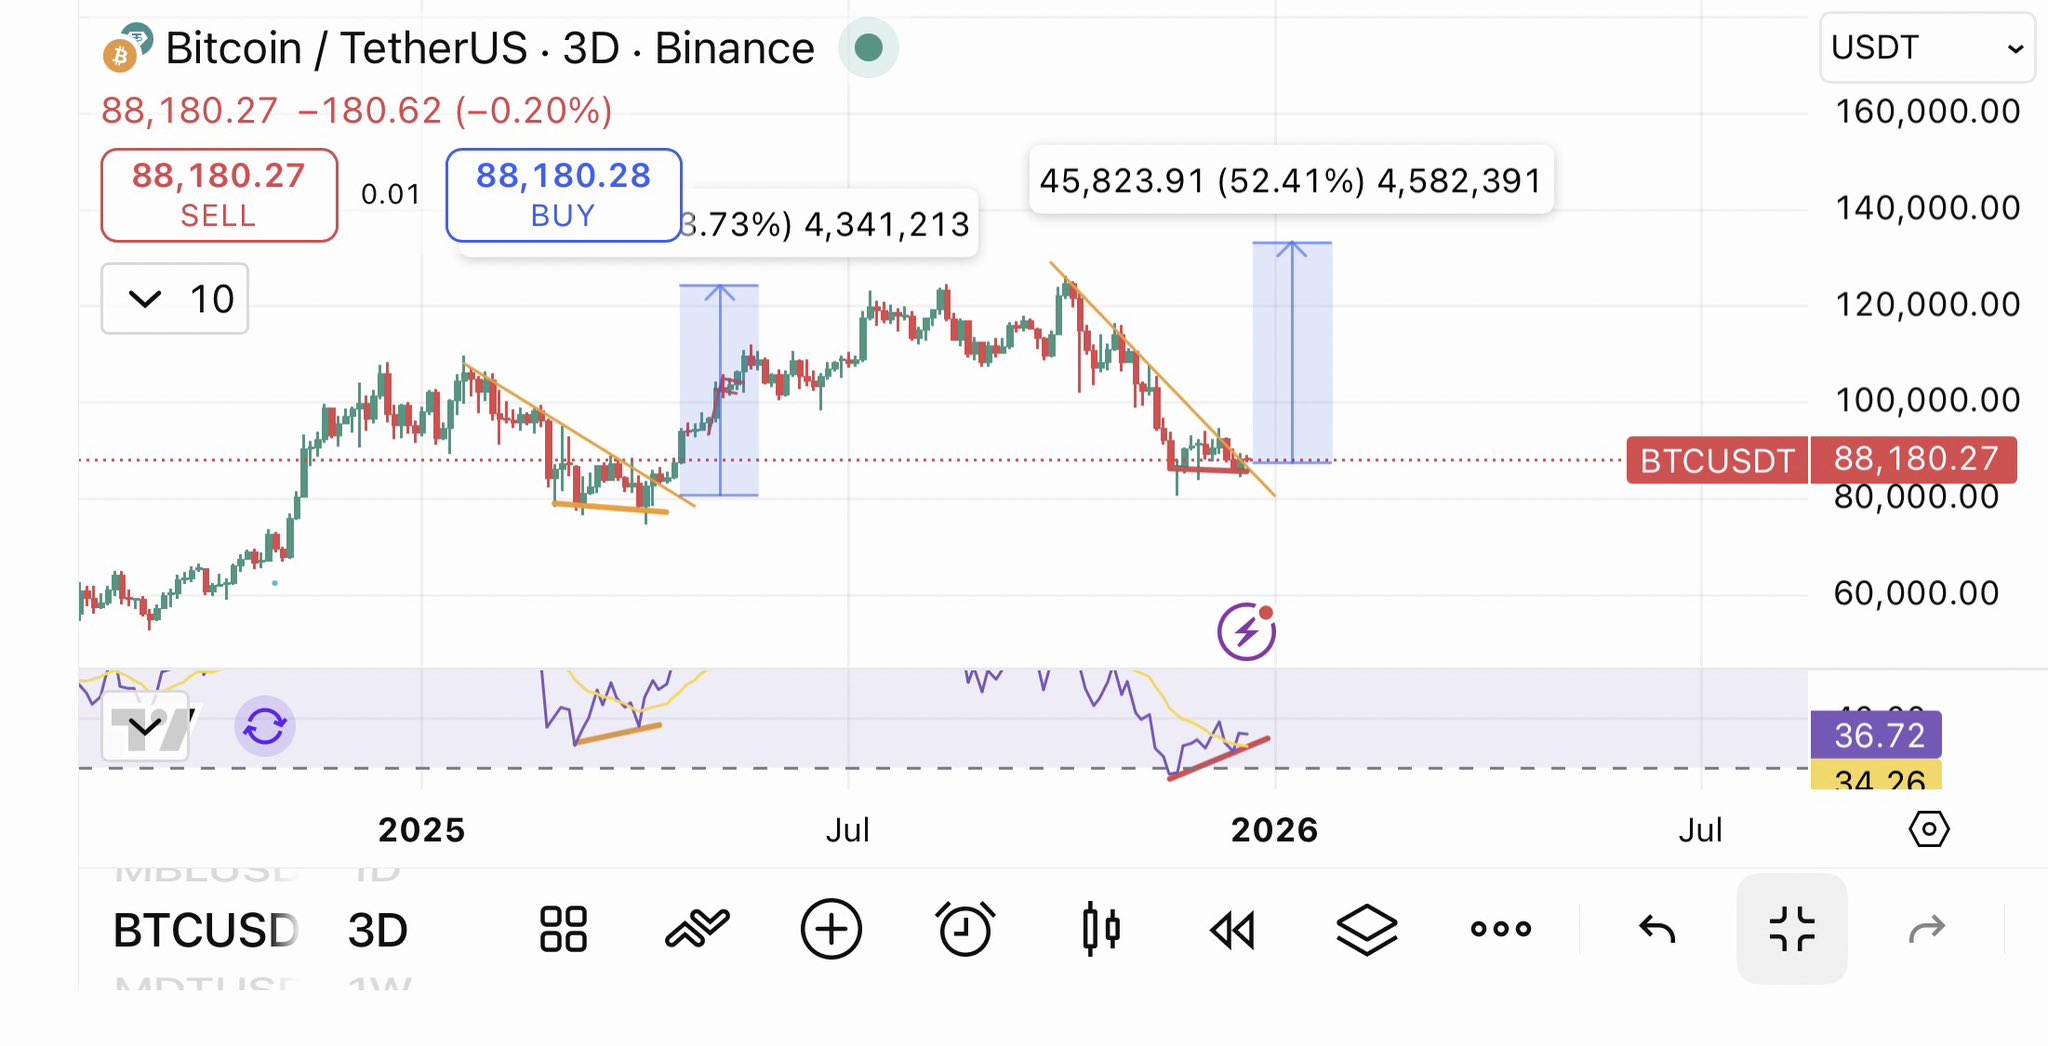
A market analyst, CryptoBull, explains Bitcoin price through a repeatable cycle-based structure tied to trend exhaustion. Notably, Bitcoin spent several months trending down a falling channel. That channel always limited rebounds and squashed price action.
Volatility reduced as price neared the apex of the channel. At last, the price of BTC has surged over the downward-moving trendline. This breakout was significant as it was preceded by long-term compression, and not impulsive upside.
Then, the case was reinforced by internal confirmation. Bullish divergence was developed under price in the last stage of consolidation. That indicator was a sign of growing demand when the price movement was subdued.
Meanwhile, the BTC market value sits at $89,581, holding above former resistance. The specialist observes the identical arrangement in the last cycle. Following such a break, Bitcoin made a close to 50% gain.
According to this symmetry, the analyst establishes a base-case target close to $133K up to March. Therefore, future Bitcoin price performance aligns with expansion rather than exhaustion.
Ethereum Price Faces a High-Stakes Structural Inflection
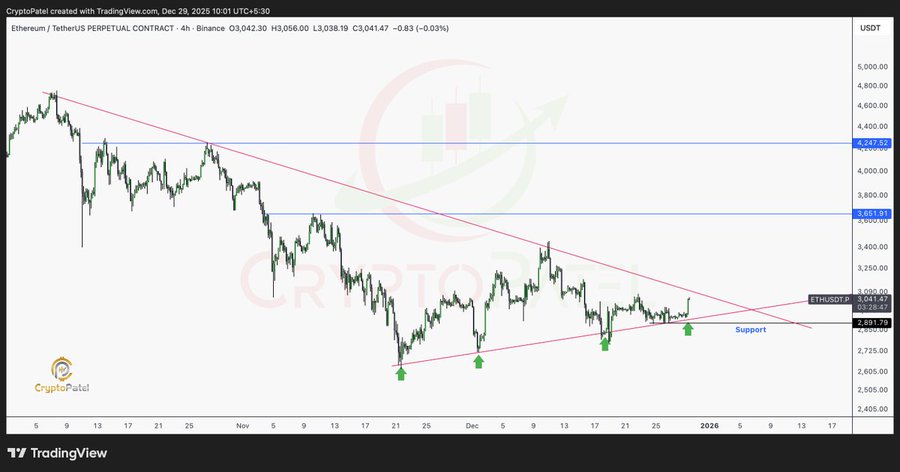
Crypto Patel analyzes Ethereum price through a high-timeframe structural lens. First, ETH was trading under a downward trendline over several months. That trendline topped upside efforts and compelled repeated drawbacks.
Every rejection contracted price action. The compression rose with Ethereum developing an ascending foundation below resistance. This structure produced directional pressure as opposed to weakness.
At the time of press, Ethereum market valuation is trading at $3,015, holding the structural demand zone of $2,890. This level defines the bullish framework.
The analyst stresses that acceptance above it preserves the structure heading into 2026. If ETH holds this zone, grwoth paths would open clearly. He sets the first upside target as 3,650, and then a wider extension to $4,250 in 2026.
These predictions are based on expansion of range and trendline resolution. However, a breakdown below demand invalidates the long-term Ethereum price forecast. Therefore, Ethereum price trades inside a clearly defined binary structure with directional expansion risk building.
XRP Price Historic Fractal Fuels Growth Prospects
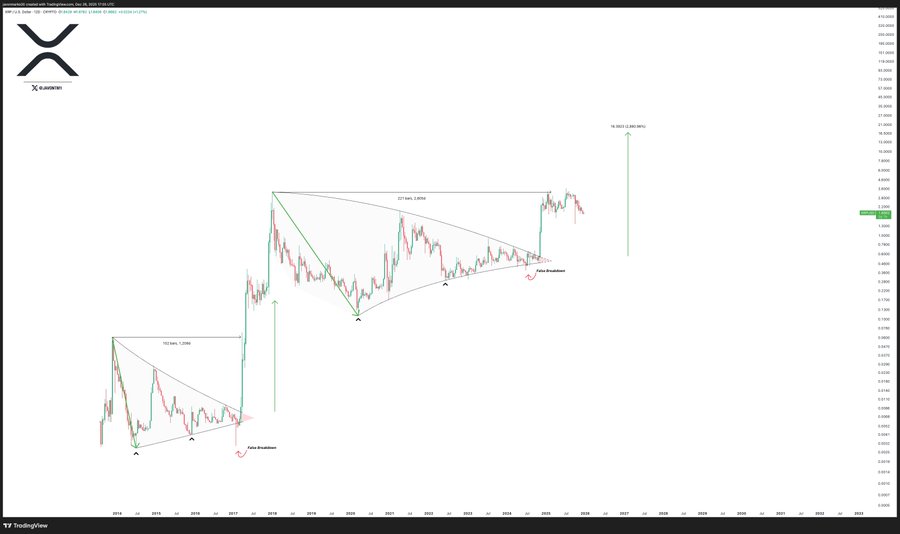
Javon Marks analyzes XRP price through historical structure repetition. To begin with, XRP has made a sharp impulse move. That desire shifted to long-term consolidation. The organization is similar to the 2017 pre-breakout phase. Price behavior was characterized by compression as volatility collapsed.
At some point, price broke out of the top. This breakout was a confirmation of structural resolution. Measured-move logic was then applicable. The breakouts in previous cycles were aggressively followed.
Javon Marks points out almost identical geometry between cycles. This is a similarity that enhances the probability of expansion. At the time of writing, the XRP market value is at $1.89, and it is firmly positioned above the breakout structure.
Notably, measured-move projections extend beyond $15. These estimates are based on symmetry and range depth, as opposed to speculation. Therefore, XRP price now trades within an expansion phase rather than early consolidation.
In conclusion, Analysts’ projections of 2026 show evident structural themes in majors. Bitcoin price reflects historical cycle symmetry pointing toward $133K.
Ethereum price holds a critical demand zone that supports targets up to $4,250. XRP price mirrors a proven breakout fractal with a $15+ measured move projection.
All the forecasts are based on high-timeframe construction, as opposed to short-term movements. Combined, these analyst opinions describe specific growth directions into 2026.
Play 10,000+ Casino Games at BC Game with Ease
- Instant Deposits And Withdrawals
- Crypto Casino And Sports Betting
- Exclusive Bonuses And Rewards

Frequently Asked Questions (FAQs)
1. What technical factors guide analyst projections for 2026?
2. Why do analysts focus on structural demand zones?
3. How do historical fractals influence crypto forecasts?

Why Trust CoinGape
CoinGape has covered the cryptocurrency industry since 2017, aiming to provide informative insights Read more…to our readers. Our journal analysts bring years of experience in market analysis and blockchain technology to ensure factual accuracy and balanced reporting. By following our Editorial Policy, our writers verify every source, fact-check each story, rely on reputable sources, and attribute quotes and media correctly. We also follow a rigorous Review Methodology when evaluating exchanges and tools. From emerging blockchain projects and coin launches to industry events and technical developments, we cover all facets of the digital asset space with unwavering commitment to timely, relevant information.
24 Hours volume
$59.28B
Market Cap
$1.45T
Max Supply
21M

Related Articles


- Crypto Market Bill Hits New Deadlock as Banks Reject White House Deal
- Why Experts Are Warning Bitcoin Rally Could Be A “Dead Cat Bounce”
- BTC and Gold Price Bounce as Trump Admin Brokers US-Venezuela 1000 Kg Gold Deal
- SEC Advances Major Crypto Securities Plan to White House for Approval
- Peter Brandt Flips Bullish, Predicts Bitcoin Rally As Price Holds Above $70k
- XRP Price As Bitcoin Reclaims $74K- Is $5 Next?
- Dogecoin Price Outlook as BTC Recovers Above $73,000
- XRP Price Prediction as Iran-U.S. Peace Talks Trigger a Crypto Rally
- COIN Stock Analysis as Bitcoin Retests $72k Ahead of February NFP Data
- Robinhood Stock Price Prediction As Cathie Wood Buys $12M Dip in Bold ARK Move
- Bitcoin Price At Risk? Professor Who Predicted US-Iran War Says America Could Lose


