 Buy $GGs
Top Analyst Sees Ethereum Price Having a “Big” Breakout as Catalysts Align


Highlights
- A top analyst believes that the Ethereum price is about to have a strong bullish breakout.
- The token has formed numerous bullish chart patterns on the daily and weekly charts.
- The coin has numerous catalysts, including the falling exchanges balances and ETF inflows.
Ethereum price held steady today, Dec. 10, rising for five consecutive days as investors braced for the upcoming Federal Reserve interest rate decision. ETH has jumped by ~25% from its lowest point last month, and a top analyst believes that it may be on the cusp of a big move.
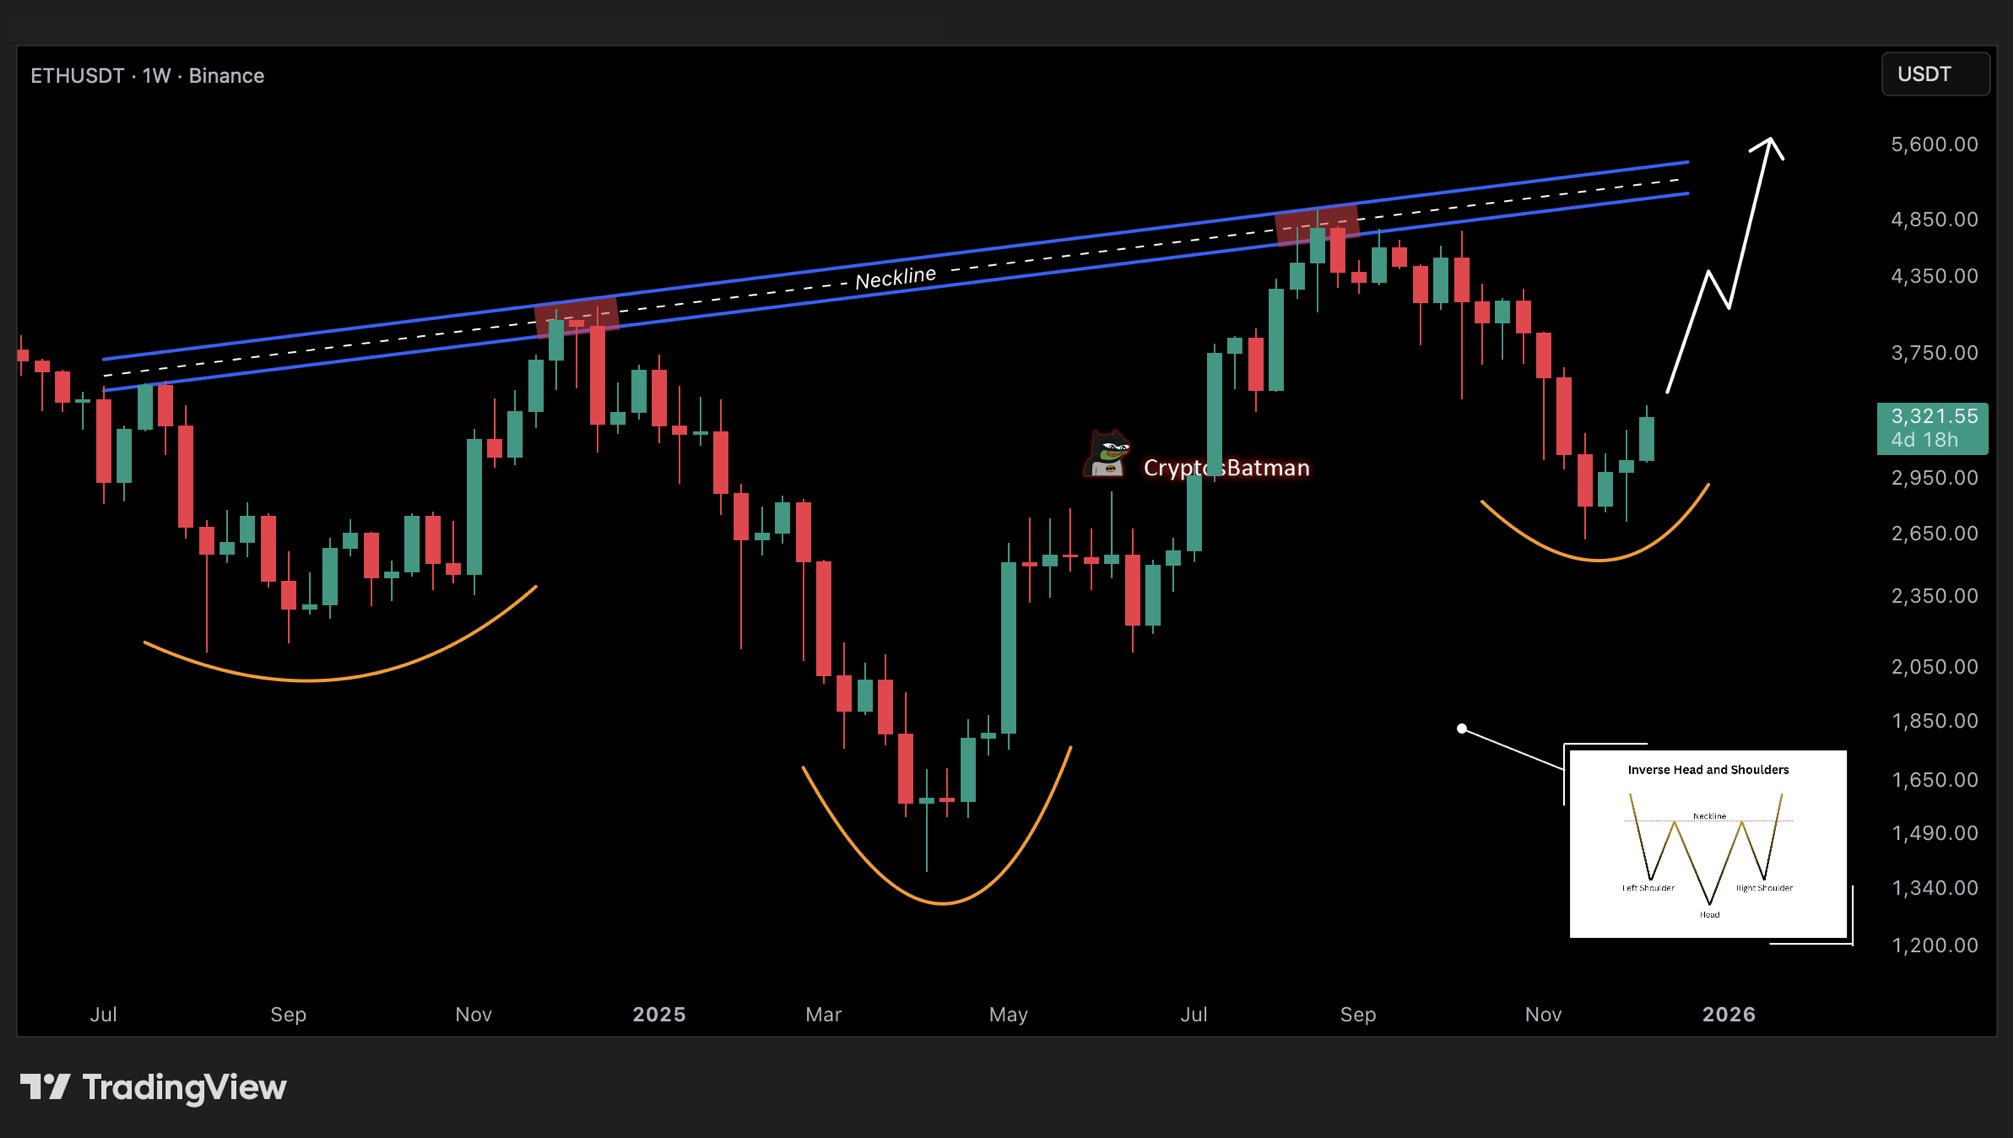
Analysis Spots an Inverse H&S Pattern on the Ethereum Price Weekly Chart
In an X post, Crypto Batman, noted that Ethereum price had formed an inverse head and shoulders pattern on the weekly chart, which may lead to a strong bullish breakout in the coming months.
This pattern is made up of an inverted head, which, in this case, is at the year-to-date low of $1,395. It also has two inverted shoulders, with the left one being at $2,130 and the right one being at $2,633. The neckline of this pattern is at $4,062.
Therefore, this pattern means that the coin may stage a comeback over time. A move to the neckline itself is a 25% increase from the current level.
The main caveat, however, is the fact that it is based on the weekly chart, which normally takes time to happen. For example, it has taken almost two years for the coin to form the pattern so far.
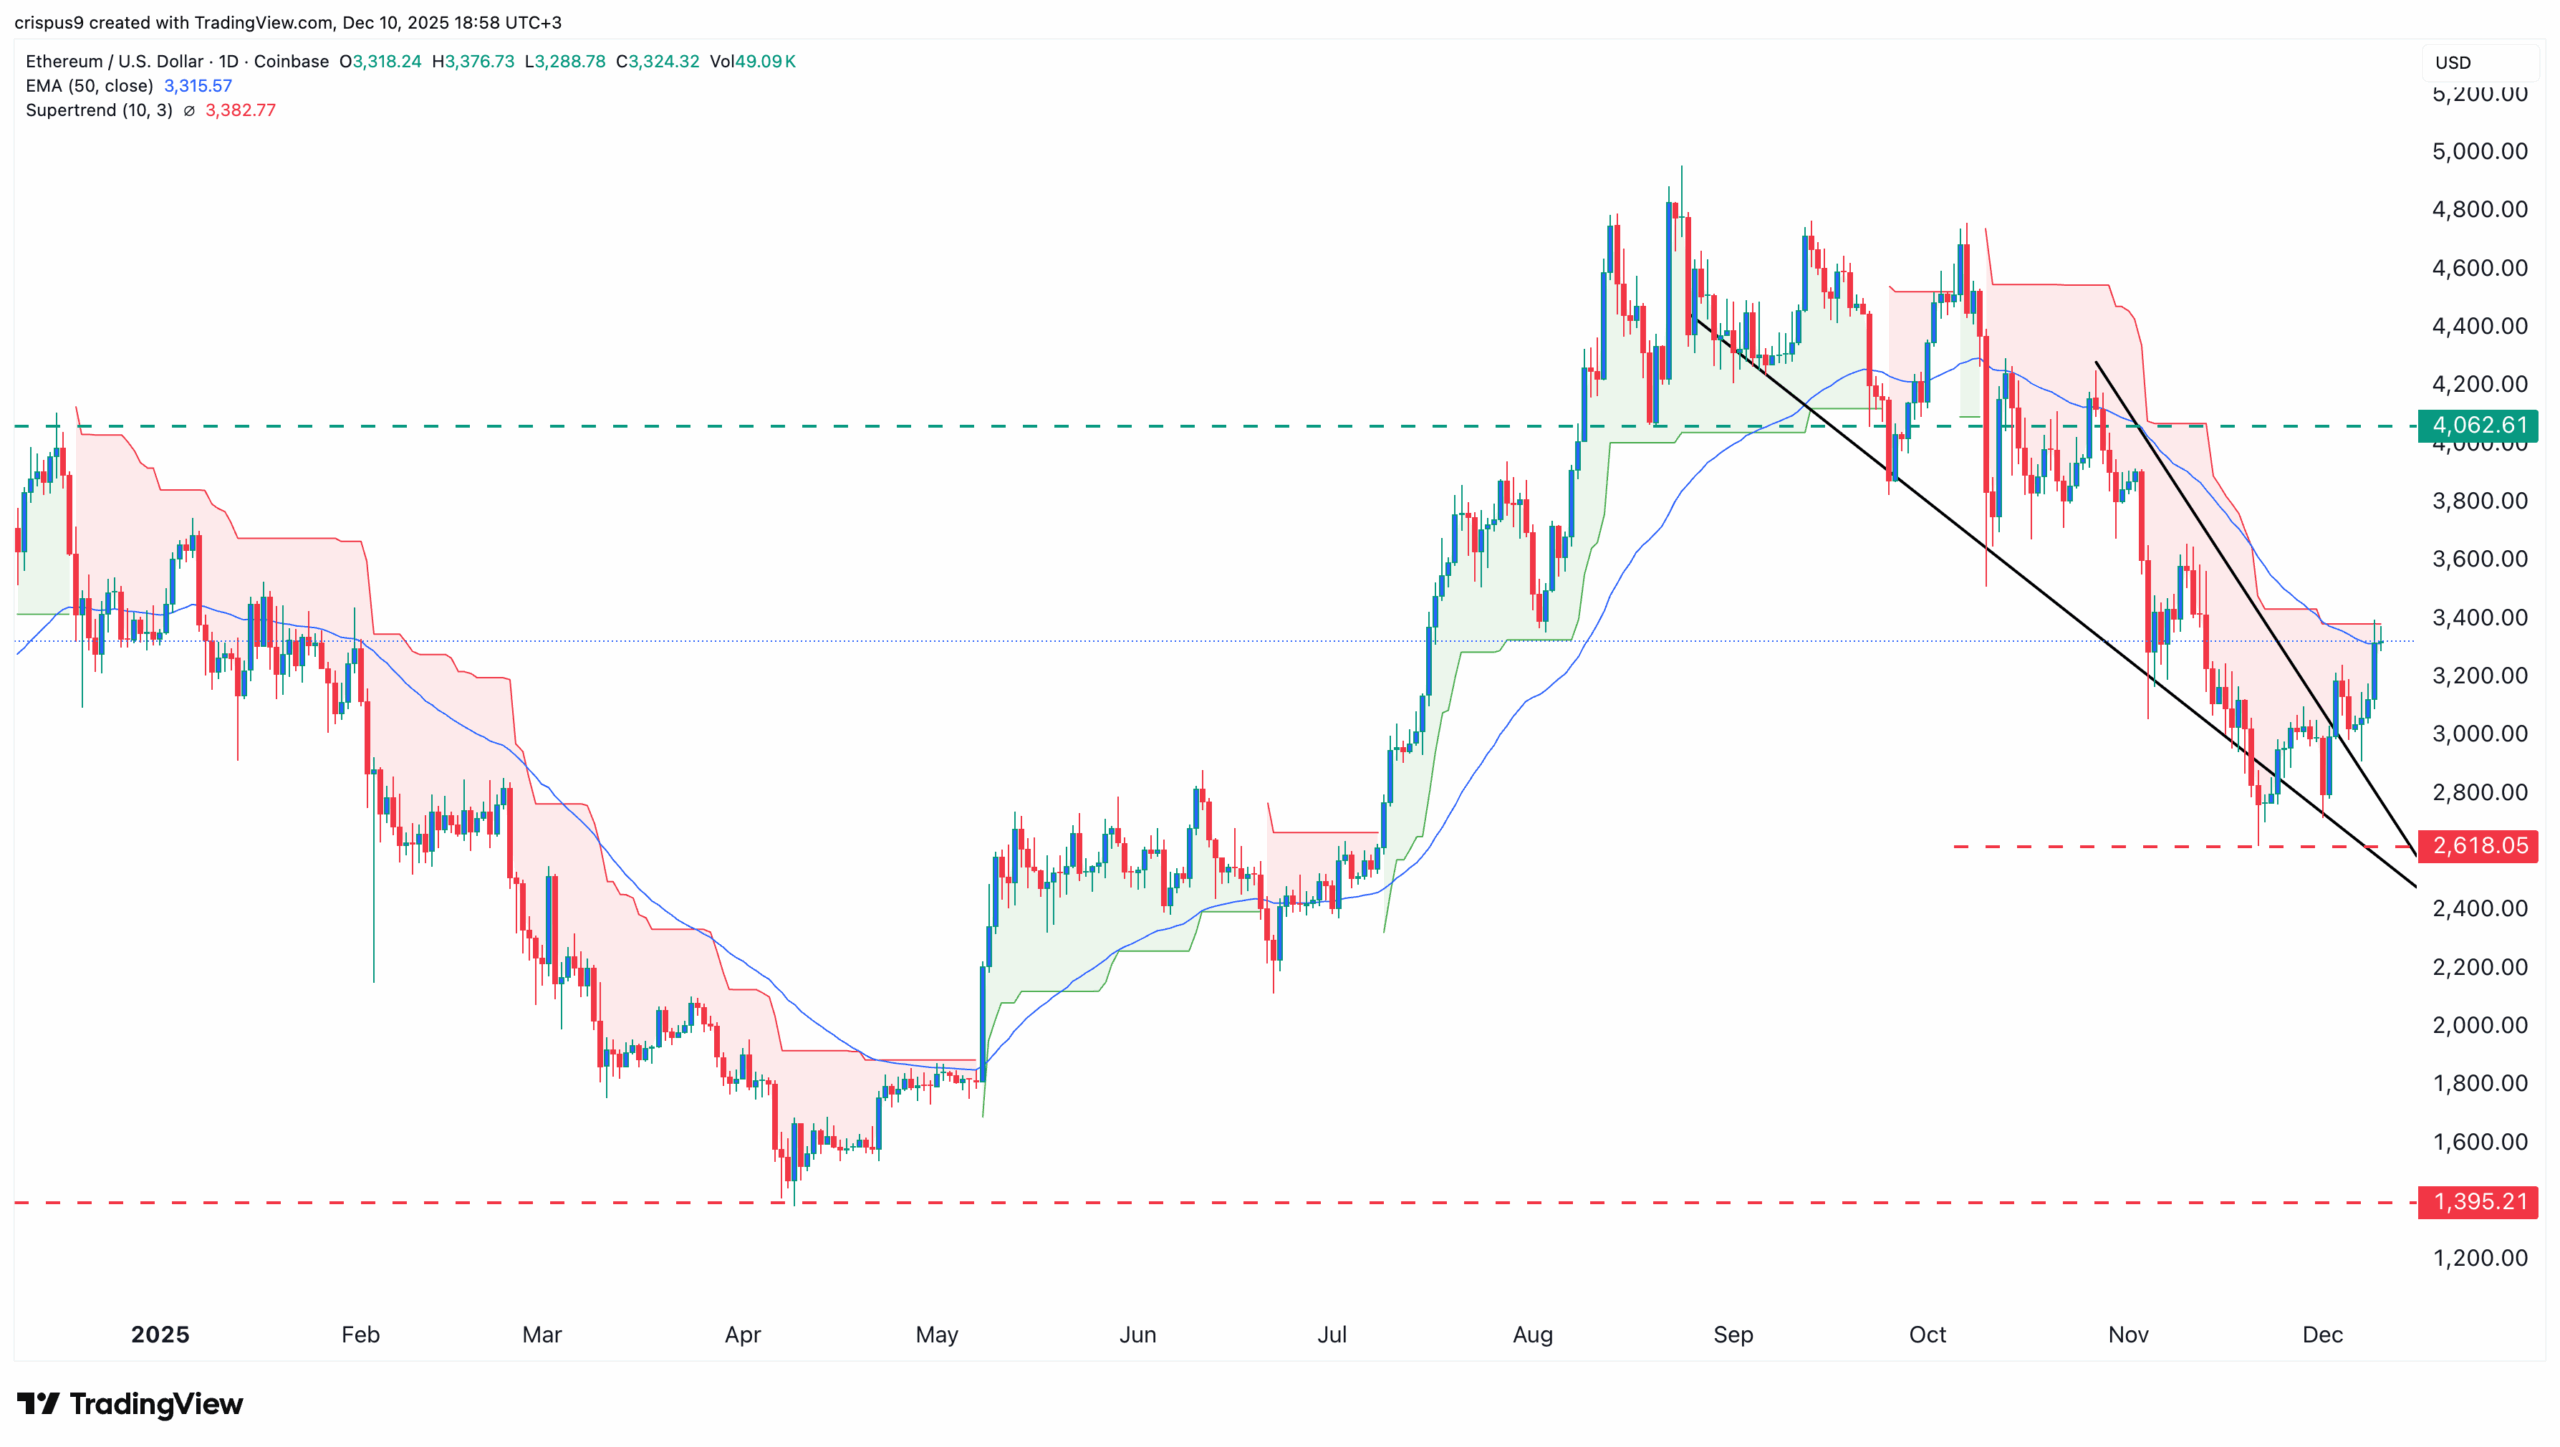
ETH Pattern Has Formed More Bullish Signs
Meanwhile, the value of ETH has formed more bullish patterns on the daily chart, confirming that bullish outlook.
One of these patterns is a falling wedge, which is made up of two descending and converging trendlines. A strong bullish breakout happens when the two lines are about to meet, which has already happened.
Ethereum price has also moved above the 50-day Exponential Moving Average, and is now attempting to move above the Supertrend indicator, a move that would be highly bullish for the token.
Therefore, a combination of a falling wedge on the daily chart and an inverse head-and-shoulders pattern on the weekly chart means that a big rebound may be on the way.
Soaring ETH Demand to Boost Its Performance
In addition to its technicals, the coin has some notable bullish catalysts, which may lead to more upside in the coming weeks or days.
It is seeing more demand from American investors, with the spot ETH ETFs adding over $177 million in inflows on Tuesday, higher than the $55 million it added on Monday. This increase brought the cumulative total inflows to $13 billion.
Ethereum is also seeing more demand from Tom Lee’s BitMine has continued to buy the token as it matches towards owning 5% of the total supply.
All this demand has led to a big drop in Ethereum supply in exchanges, which has dropped to a record low. A significant drop in this supply is a sign that more people are moving their tokens from exchanges.
Play 10,000+ Casino Games at BC Game with Ease
- Instant Deposits And Withdrawals
- Crypto Casino And Sports Betting
- Exclusive Bonuses And Rewards

Frequently Asked Questions (FAQs)
1. What is the most likely Ethereum price prediction?
2. Is Ethereum a good coin to buy today?
3. How high can the ETH price rise?

Why Trust CoinGape
CoinGape has covered the cryptocurrency industry since 2017, aiming to provide informative insights Read more…to our readers. Our journal analysts bring years of experience in market analysis and blockchain technology to ensure factual accuracy and balanced reporting. By following our Editorial Policy, our writers verify every source, fact-check each story, rely on reputable sources, and attribute quotes and media correctly. We also follow a rigorous Review Methodology when evaluating exchanges and tools. From emerging blockchain projects and coin launches to industry events and technical developments, we cover all facets of the digital asset space with unwavering commitment to timely, relevant information.

Related Articles


- Senate Eyes CLARITY Act Markup This Month as Banks, Crypto Continue Stablecoin Yield Talks
- Why XRP Price Rising Today? (2 March)
- Breaking: Bitcoin Price Rises to $70k as Gold Crashes Amid U.S.-Iran Conflict
- Bitcoin News: Anthony Pompliano’s ProCap Buys 450 BTC, Gold Bug Peter Schiff Reacts
- Fed Rate Cuts More Likely If U.S.-Iran Conflict Extends, Arthur Hayes Predicts
- Top 5 Historical Reasons Dogecoin Price Is Not Rising
- Pi Coin Price Prediction for March 2026 Amid Network Upgrade, KYC Boost, Rewards Distribution
- Gold Price Nears ATH; Silver Eyes $100 Breakout on Us- Iran War
- Bitcoin And XRP Price As US Kills Iran Supreme Leader- Is A Crypto Crash Ahead?
- Gold Price Prediction 2026: Analysts Expect Gold to Reach $6,300 This Year
- Circle (CRCL) Stock Price Prediction as Today is the CLARITY Act Deadline


