Uniswap Token Price Falling in Response to Channel Pattern; Back to $4.6?


Under the influence of a falling channel pattern, the Uniswap token price showed a steady downfall in the past five weeks. However, the very nature of this pattern is to resume a strong bull rally once the price breaks the overhead trendline. Thus, interested buyers must wait for pattern breakout to get the right entry opportunity.
Key points Uniswap token price analysis:
- The UNI price will continue its downward spiral until the falling channel pattern is intact
- A bullish RSI divergence suggests the UNI prices may soon witness a significant recovery
- The 24-hour trading volume in the Uniswap token is $120 Million, indicating a 88% gain.
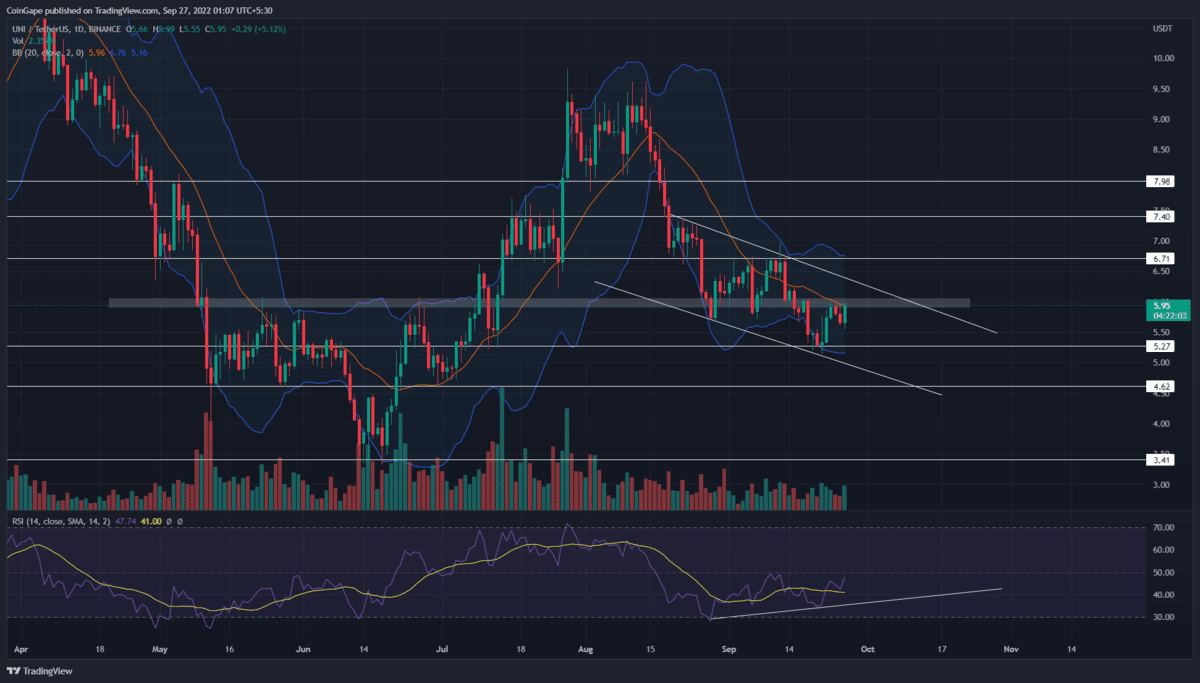
 Source-Tradingview
The recent correction in the crypto market plunged the Uniswap token to local support of $5.27. The downfall has offset nearly 70% of gains obtained during the previous recovery rally. The coin price rebounded from the $5.27 support and initiated a minor pullback.
The price reversal soared the Uniswap token price by 14.3% and retested the $6 level as potential resistance. Last three days, the coin chart showed a higher price rejection candle at the $6 resistance, indicating the sellers are aggressively deafening this level.
Moreover, the daily time frame chart showed the formation of a falling parallel channel pattern. The resistance trendline of this pattern wavering at the $6 mark offers an additional hurdle against the bullish growth.
This confluence resistance could exert significant selling pressure on traders to revert the prices lower. As a result, the potential reversal will indicate the resumption of prevailing correction and tumble of the Uniswap token price by 10.84% to break the $5.27.
On a contrary note, the technical setup indicates the coin price should eventually breach the resistance trendline to trigger a new recovery rally.
Technical indicator
RSI indicator: the daily-RSI slope shows an evident bullish divergence concerning the last two lower lows in price action. This divergence indicates growth in bullish momentum and a better possibility for the bullish breakout from the channel pattern.
Bollinger band indicator: the coin price retest to the indicator’s midline will encourage downfall continuation.
- Resistance levels- $6, $6.7
- Support levels- $5.27 and $4.65

Why Trust CoinGape
CoinGape has covered the cryptocurrency industry since 2017, aiming to provide informative insights Read more…to our readers. Our journal analysts bring years of experience in market analysis and blockchain technology to ensure factual accuracy and balanced reporting. By following our Editorial Policy, our writers verify every source, fact-check each story, rely on reputable sources, and attribute quotes and media correctly. We also follow a rigorous Review Methodology when evaluating exchanges and tools. From emerging blockchain projects and coin launches to industry events and technical developments, we cover all facets of the digital asset space with unwavering commitment to timely, relevant information.

Related Articles


- CLARITY Act: Trump’s Crypto Adviser Says Stablecoin Yield Deal Is “Close” as March 1 Deadline Looms
- Trump Tariffs: U.S. To Impose 10% Global Tariff Following Supreme Court Ruling
- CryptoQuant Flags $54K Bitcoin Risk As Trump Considers Limited Strike On Iran
- Why Is Bitdeer Stock Price Dropping Today?
- Breaking: U.S. Supreme Court Strikes Down Trump Tariffs, BTC Price Rises
- Ethereum Price Rises After SCOTUS Ruling: Here’s Why a Drop to $1,500 is Possible
- Will Pi Network Price See a Surge After the Mainnet Launch Anniversary?
- Bitcoin and XRP Price Prediction As White House Sets March 1st Deadline to Advance Clarity Act
- Top 3 Price Predictions Feb 2026 for Solana, Bitcoin, Pi Network as Odds of Trump Attacking Iran Rise
- Cardano Price Prediction Feb 2026 as Coinbase Accepts ADA as Loan Collateral
- Ripple Prediction: Will Arizona XRP Reserve Boost Price?


