 Buy $GGs
Weekly Bullish Formation Looks For 15% Gains In Bitcoin: Analysis


Bitcoin bulls took a breather today. In the previous session, the price zoomed 10%. The continuation of the upside momentum needs additional buying participation. As of press time, BTC/USD is trading at $21,607, down 0.27%.
- Bitcoin price consolidates near higher levels waiting for more bullish confirmation.
- A weekly close above $22,000 would strengthen the upside outlook.
- This would be the second week of gains.
Bitcoin price consolidates
After a fall of more than 70%, Bitcoin finally formed a bottom. The trend is expected to reverse from bearish to bullish, provided the given condition are met.
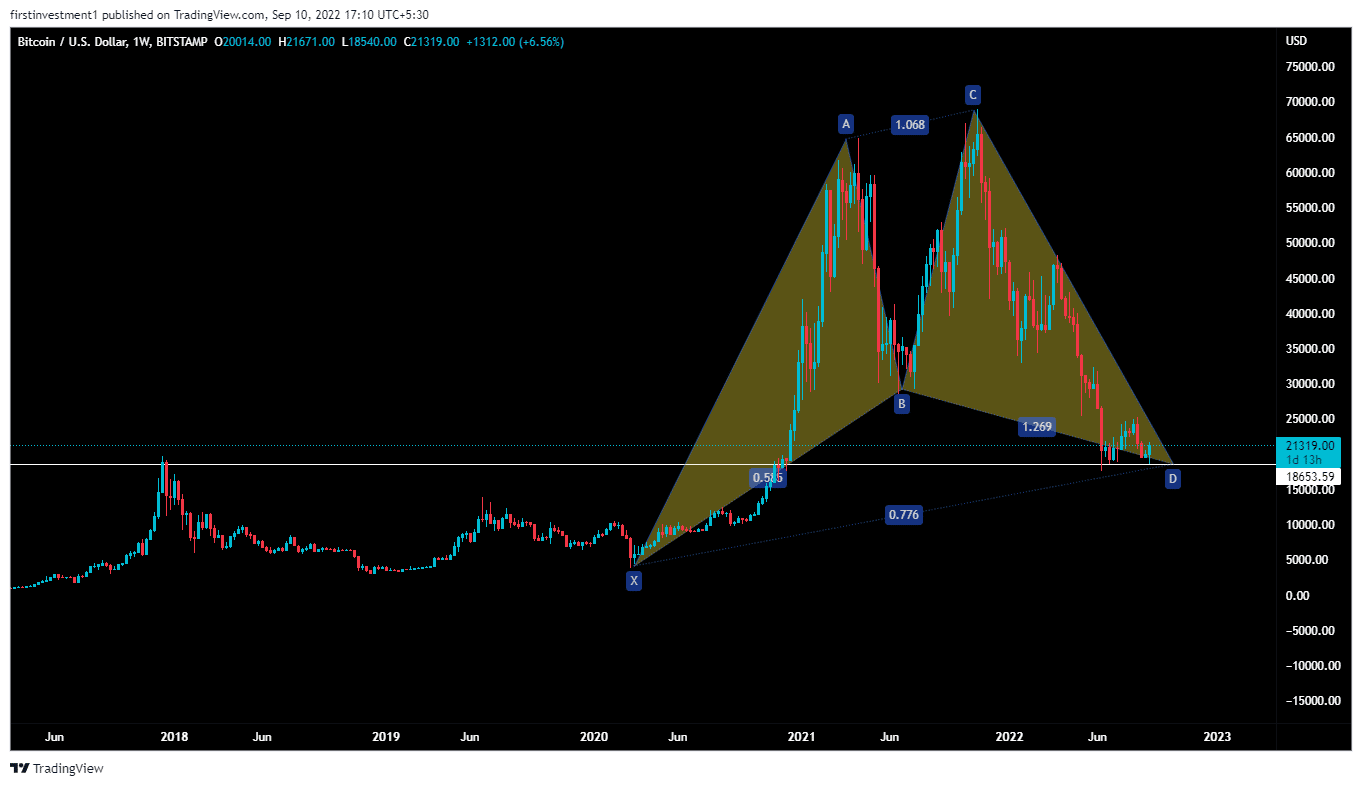
On the weekly time frame, Bitcoin formed a bullish “Cypher Harmonic” pattern. The Cypher pattern is a reversal formation within the harmonic class of patterns. The Cypher formation often occurs within a trending phase of the market and appears as a terminal move. That is to say that, upon completion of the formation, there should be a reversal in the market.
The risk-to-reward ratio of this pattern is very high. The expected upward move could be expected near $36,000.
The second pattern, formed by BTC is the “Double Bottom” structure. On November 2021, the BTC price tested the all-time high of $69,000 & fell from there afterward. Since then Bitcoin has been in a downward spiral and hit the bottom in June 2022. The investors eroded 73% of their holding values.
However, the bulls managed to hold this support level for the past three-month. Now, It is very clear that Low made on June 13, 2022, is gonna be strong from now on, and had become a bottom as well.
Bitcoin gave a rally of more than 10%, yesterday as an influx of volume transactions pours into the market. the flagship currency is likely to take a pause on higher levels, forming an Inside candle. If the price starts to move above today’s highs, then we can enter into a buy trade.
Also read: How Will Elon Musk’s Deflation Warning Affect Crypto
The nearest support is ($19,600), whereas the most immediate resistance is around ($22,600). There is a higher probability of the price breaking its resistance near higher levels. But, if any chance price tends to come close to its support, and we’ve seen any rejection there with rising volumes, then we can buy there as well the “Buy on dips” opportunity.
On the other hand, a break below the $19,500 level could invalidate the bullish outlook. And the price can test $18,000
Bitcoin is bullish on all time frames. Above $21,700 closing on the hourly time frame, we can put a trade on the buy side.
Play 10,000+ Casino Games at BC Game with Ease
- Instant Deposits And Withdrawals
- Crypto Casino And Sports Betting
- Exclusive Bonuses And Rewards


Why Trust CoinGape
CoinGape has covered the cryptocurrency industry since 2017, aiming to provide informative insights Read more…to our readers. Our journal analysts bring years of experience in market analysis and blockchain technology to ensure factual accuracy and balanced reporting. By following our Editorial Policy, our writers verify every source, fact-check each story, rely on reputable sources, and attribute quotes and media correctly. We also follow a rigorous Review Methodology when evaluating exchanges and tools. From emerging blockchain projects and coin launches to industry events and technical developments, we cover all facets of the digital asset space with unwavering commitment to timely, relevant information.

Related Articles


- Analyst Predicts Bitcoin Price Dip to $55K as ETFs See Outflows Amid Middle East Tensions
- Ethereum Co-founder Sparks $157M Sell-Off Fears as ETH Struggles Below $2k
- Analyst Predicts XRP Price Could Fall to $1 as XRP ETFs Record Net Weekly Outflows
- U.S.-Iran War: Trump Threatens to Hit Iran ‘Very Hard’ Today as Bitcoin Faces New Selling Pressure
- Crypto Market Weekly Recap: US-Iran War Steer Crypto Prices, Kraken Gets Fed Master Account, Tokenization Push March 2-6
- Dogecoin, Pepe coin, and Shiba Inu Price Prediction As BTC Crashes Below $70k
- Here’s Why Cardano Price Has Not Reclaimed $0.30
- Will XRP Price Crash as U.S. Nonfarm Payrolls Fell by 92,000 in February?
- Pi Network Price Eyes a 40% Surge as Pi Day Looms on March 14
- Top Reasons Why Circle Stock Price is Surging
- Gold Price Prediction as US-Iran War Hits the Second Week


