
What’s Next For Ethereum Price after a Breakdown Below $1900?


On July 24th, Ethereum price witnessed a significant outflow and breached the bottom support of the megaphone pattern. This bearish momentum accompanied by an uptick in trading volume suggests a strong likelihood of further price depreciation. However, with no follow-up to the breakdown candle, the downtrend momentum is under question, sparking a slight possibility of a bear trap.
Also Read: Ethereum Price Rally Awaits This Bullish Pattern Confirmation
Ethereum Price Daily Chart
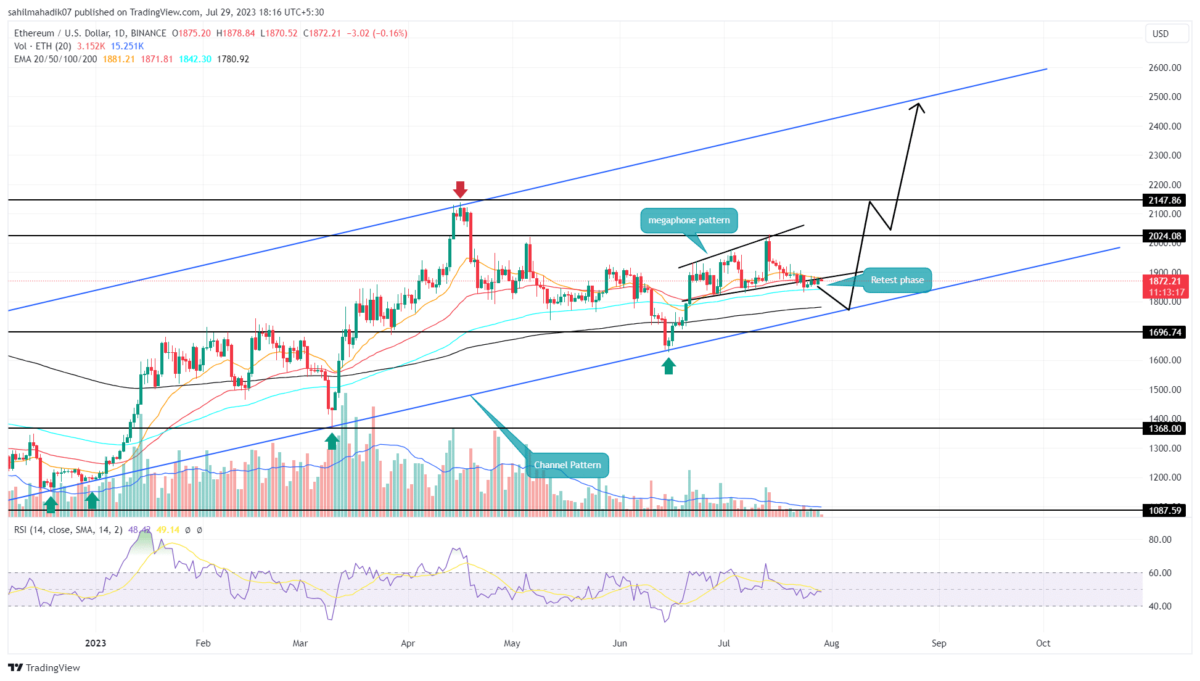
- The 20-day EMA flipped into a dynamic resistance for Ethereum buyers
- A rising channel pattern is a carrier of the current bull run.
- The intraday trading volume in Ethereum is $31.6 Billion, indicating a 19% loss.
 Source-Tradingview
Over the past four days, Ethereum price movement with alternative green and red candles reflects uncertainty among market participants. With the price wavering below the recently breached support trendline at $1900, it seems that sellers are attempting to sustain below their newly gained resistance. At the time of writing, Ethereum, the second leading cryptocurrency, is being traded at $1872, a modest intraday gain of 0.13%.
The daily candles with higher price rejection indicate the supply momentum is building. If the pressure from sellers continues to mount, the ETH price could see a steep drop of 5%, potentially bringing the price down to the psychological support level of $1800.
However, the anticipated downfall could retest the support trendline of a rising channel pattern creating a high accumulation zone for potential buyers. If the coin buyers manage to hold this trendline, the replenished bullish momentum could set off a new recovery cycle.
[converter id=”eth-ethereum” url=”https://coingape.com/price/converter/eth-to-usd/?amount=1″]
Can ETH Price Claw its Way Back to $2000?
A high momentum breakdown below the significant support could lead to a rapid decline, reaching its targeted low without much delay. However, if the ETH price continues to fluctuate below the breached trendline, it could be a sign of waning bearish momentum. If buyers take advantage of this, the coin price will enter the megaphone. This possible breakout will validate the prior breakdown as a bear trap and bolster buyers for a rally above $200

Why Trust CoinGape
CoinGape has covered the cryptocurrency industry since 2017, aiming to provide informative insights Read more…to our readers. Our journal analysts bring years of experience in market analysis and blockchain technology to ensure factual accuracy and balanced reporting. By following our Editorial Policy, our writers verify every source, fact-check each story, rely on reputable sources, and attribute quotes and media correctly. We also follow a rigorous Review Methodology when evaluating exchanges and tools. From emerging blockchain projects and coin launches to industry events and technical developments, we cover all facets of the digital asset space with unwavering commitment to timely, relevant information.


