What’s Next for XRP Price After Losing 25% in Correction?


The XRP price experienced a significant surge recently but encountered resistance at $0.91, leading to a correction phase. Corrections play an important role in the financial markets as they help establish more sustainable price levels. In this case, the bearish pullback plunged the prices by 26%, reaching the 32.8% Fibonacci retracement level at $0.65. Over the past few days, the coin’s price has shown some stability at this local level. However, the question remains whether this is sufficient for a resumption of the prior recovery.
Also Read: XRP Price Poised To Massive Surge Despite Gaining 63%; Here’s Why
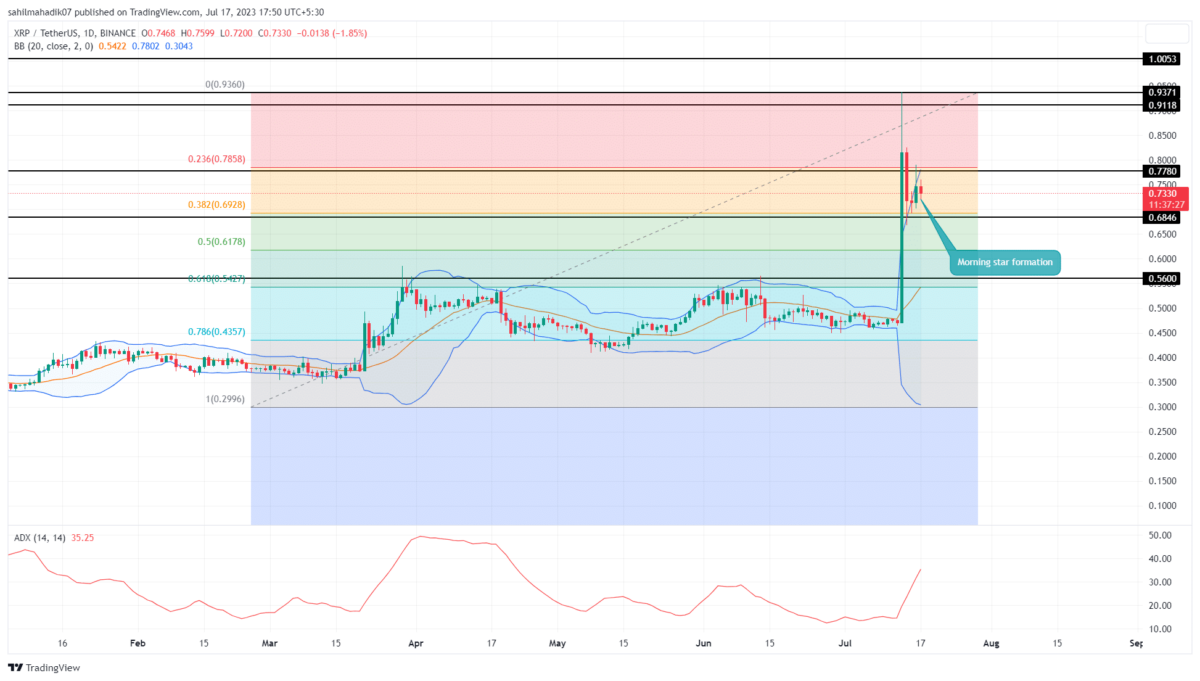
XRP Price Daily Chart:
- Overhead supply reflects the XRP price is poised for a long correction
- The $0.62 support near 50% FIB creates strong support are
- The intraday trading volume in the XRP is $3.4 Billion, indicating a 16% gain.
 Source: Tradingview
On July 16th, the XRP price exhibited a morning star candle pattern at the recently established $0.65 support level. This candle pattern formation indicates a potential reversal of the prevailing downtrend and a shift toward bullish momentum.
However, when analyzing the daily chart, it becomes evident that there was substantial selling pressure shown in the form of rejection wick at the green candle of the morning star. Additionally, today’s 0.9% loss suggests a lack of follow-through to the reversal candle, further indicating weakness in bullish momentum.
Therefore, it is possible that the XRP price could undergo a prolonged correction if it breaches the $0.65 support level. In such a scenario, the potential breakdown may cause the price to decline by an additional 7.5%, reaching the 50% retracement level at $0.62.
[converter id=”xrp-xrp” url=”https://coingape.com/price/converter/xrp-to-usd/?amount=1″]
Will XRP Price Continue Correction Trend?
A prolonged correction would plummet the XRP price to a 50% Fibonacci retracement level of $0.62. The 50% FIB represents a key point of potential support and an area of price reversal. Therefore, if the XRP price manages to sustain this level, the overall trend would remain bullish. Conversely, if the price break $0.62 support, it would indicate a weakening of the bullish momentum and potentially open the door for further correction
- Bollinger Band: The upper band of the BB indicator still challenges on the upside indicating buying pressure is active,
- Average Directional Index: The ADX price approaching 40% reflects instability and a need for correction.

Why Trust CoinGape
CoinGape has covered the cryptocurrency industry since 2017, aiming to provide informative insights Read more…to our readers. Our journal analysts bring years of experience in market analysis and blockchain technology to ensure factual accuracy and balanced reporting. By following our Editorial Policy, our writers verify every source, fact-check each story, rely on reputable sources, and attribute quotes and media correctly. We also follow a rigorous Review Methodology when evaluating exchanges and tools. From emerging blockchain projects and coin launches to industry events and technical developments, we cover all facets of the digital asset space with unwavering commitment to timely, relevant information.