Where May Bitcoin Price Head in June; $30k or $22k?


The largest cryptocurrency, Bitcoin, has impressively withstood the recent sell-off in the crypto market. While the majority of altcoins witnessed prolonged corrections, BTC remained sideways, holding crucial support levels. Despite highly volatile behavior, the coin’s price strictly adheres to the long coming wedge pattern, indicating a reliable chart setup for predicting the near-term future.
Also Read: Bitcoin Price At a Crossroads Despite Bear Market Stability – US SEC Triggers Altcoins Uncertainty
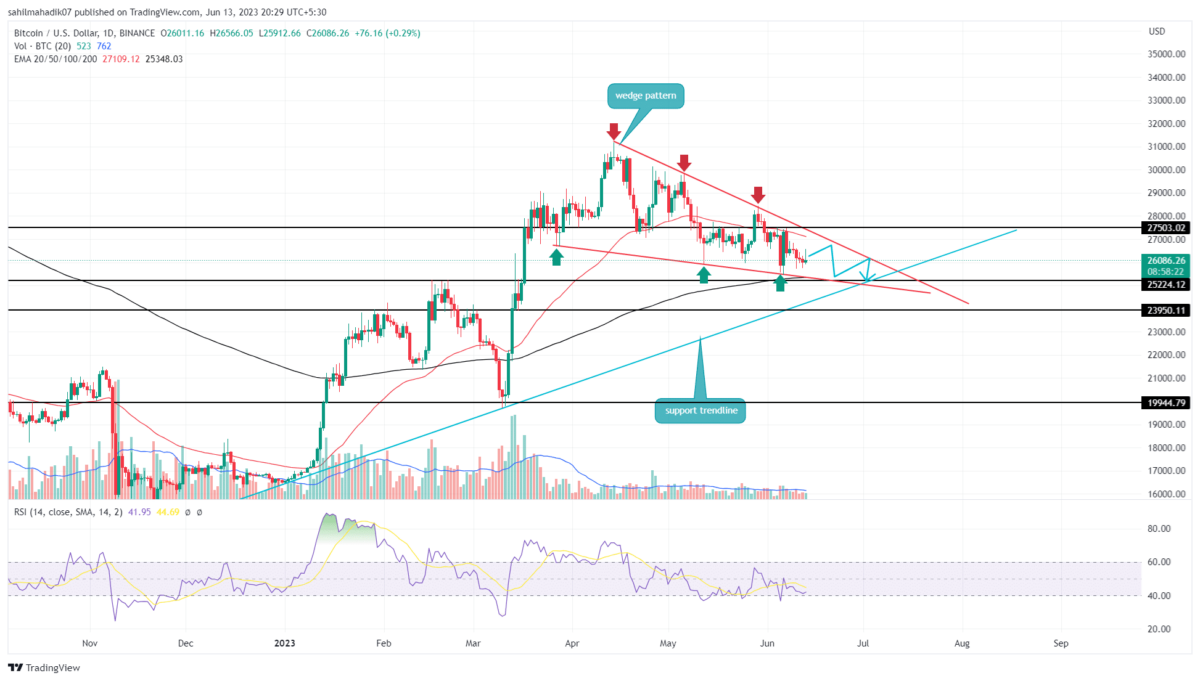
Bitcoin Price Daily Chart:
- The decreased volume throughout the two-month correction phase indicates that this downfall is temporary.
- Completing the wedge pattern will end the Bitcoin price’s current sideways trend.
- The intraday trading volume in Bitcoin is $12.2 billion, indicating a 22% loss.
 Source: Tradingview
Sideways Action and Breakout Opportunity:
Over the past six days, the Bitcoin price has showcased several short-bodied candles with long-rejection wicks on either side. These candles of uncertainty reflect no clear dominance from buyers or sellers, suggesting that coin holders could witness high volatility in the coming days.
While prices may continue the sideways action for a week or two, the wedge pattern’s trendlines are gradually converging, indicating that the narrow space will soon trigger a breakout opportunity. In theory, the wedge pattern is a continuation pattern, and therefore, the Bitcoin price is likely to break the overhead trendline.
The potential breakout will accelerate the bullish momentum and may offer entry opportunities to traders, with the post-breakout setting the BTC price to shoot above $30,000.
Will Bitcoin Price Hit $20,000?
The support trendline of the wedge pattern has prevented the Bitcoin price from experiencing excessive downfall despite increased bearishness in the crypto market. Therefore, the coin uses this level as a key support to maintain a bullish outlook. Until that trendline is intact, the Bitcoin price is less likely to go below $25,000.
- Relative Strength Index: The daily RSI slope wavering below the midline (50) gives a slight negative momentum in price.
- Exponential Moving Average: The 50-day and 200-day EMAs aligned with the converging trendline give additional confirmation of a narrow range, with a breakout triggering a directional rally.

Why Trust CoinGape
CoinGape has covered the cryptocurrency industry since 2017, aiming to provide informative insights Read more…to our readers. Our journal analysts bring years of experience in market analysis and blockchain technology to ensure factual accuracy and balanced reporting. By following our Editorial Policy, our writers verify every source, fact-check each story, rely on reputable sources, and attribute quotes and media correctly. We also follow a rigorous Review Methodology when evaluating exchanges and tools. From emerging blockchain projects and coin launches to industry events and technical developments, we cover all facets of the digital asset space with unwavering commitment to timely, relevant information.

Related Articles


- Bitcoin vs Gold Feb 2026: Which Asset Could Spike Next?
- Top 3 Reasons Why Crypto Market is Down Today (Feb. 22)
- Michael Saylor Hints at Another Strategy BTC Buy as Bitcoin Drops Below $68K
- Expert Says Bitcoin Now in ‘Stage 4’ Bear Market Phase, Warns BTC May Hit 35K to 45K Zone
- Bitcoin Price Today As Bulls Defend $65K–$66K Zone Amid Geopolitics and Tariffs Tensions
- COIN Stock Price Prediction: Will Coinbase Crash or Rally in Feb 2026?
- Shiba Inu Price Feb 2026: Will SHIB Rise Soon?
- Pi Network Price Prediction: How High Can Pi Coin Go?
- Dogecoin Price Prediction Feb 2026: Will DOGE Break $0.20 This month?
- XRP Price Prediction As SBI Introduces Tokenized Bonds With Crypto Rewards
- Ethereum Price Rises After SCOTUS Ruling: Here’s Why a Drop to $1,500 is Possible


