 Buy $GGs
Bitcoin Price Prediction and Analysis: Will BTC Hit $100k Before Year-End?


Highlights
- Analyst's range-focused thesis aligns with low year-end breakout probability.
- The 4H structure confirms controlled rotation between defined supply and demand zones.
- Q4 performance marks Bitcoin’s weakest seasonal showing since 2018.
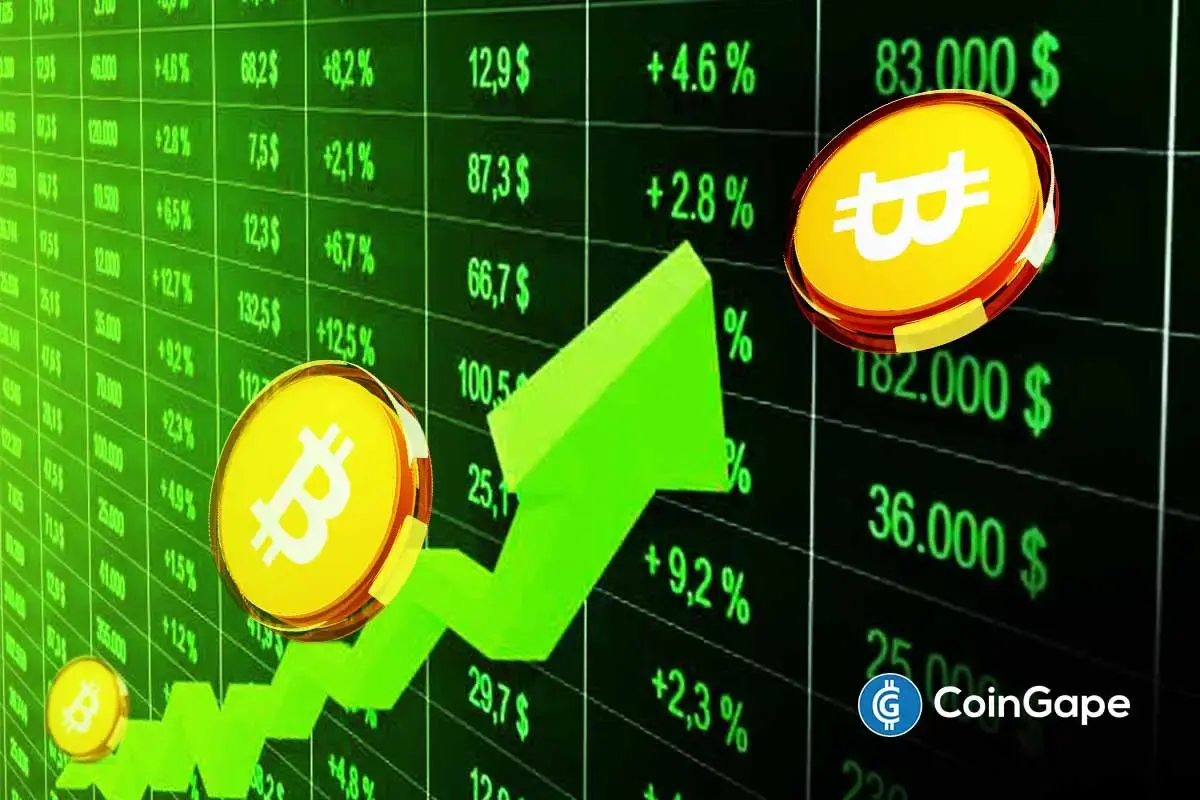
Bitcoin price moves into the final trading sessions with uncertainty around upside continuation. BTC price has struggled to reclaim higher resistance despite earlier optimism. The market structure is now an indication of consolidation rather than growth. The participants re-evaluate the end-year expectations when liquidity becomes thin and volatility narrows.
Notably, Bitcoin price remains capped below zones that rejected prior advances. Predictions are more and more based on probability-based indicators as opposed to belief. The debate on a possible move of $100,000 is still ongoing, but confidence is dwindling.
Analyst’s Market Thesis Hits Low $100K Probability.
Bitcoin price analysis from analyst Lenaert Snyder emphasizes structure over speculation. BTC price recently rejected the $90,500 level after a failed recovery attempt. That rejection pushed the price down to less than $88,000, which transformed previous support into resistance.
As a result, the specialist is concerned with range-based execution rather than directional bias. He singles out the $85,900 area as the most optimum area to be exposed to in the long run. This is a disciplined strategy as opposed to pessimism.
Notably, Polymarket probability data supports this stance. The platform assigns only a 7% chance of Bitcoin price reaching $100,000 before year-end. These odds indicate lesser belief in wider positioning.
Meanwhile, thin holiday liquidity limits follow-through potential. BTC price therefore remains constrained by structure and probability rather than expectation-driven narratives.

Range Control Dominates the 4H Bitcoin Price Structure
Bitcoin price structure on the 4-hour chart reflects controlled range behavior rather than directional expansion. BTC price continues respecting a broad trading band defined by clear supply and demand zones.
Attacks on price continue to fail around the 94,000-95,000 price resistance zone. That area takes up purchasing pressure and causes lower rotations. Every rejection strengthens the range ceiling and restricts upside continuation.
Meanwhile, downside movement consistently attracts demand near the $85,000-$86,000 support zone. This area has been defended by buyers in several tests, which is an indication of structural relevance. The market value of BTC is close to range equilibrium with the price standing at approximately 87,400.
RSI is below the 50 midpoint which shows subdued upside strength. This structure prefers rotational price action. The future Bitcoin price performance depends on reclaiming $95,000 with acceptance, not brief rebounds.

Q4 Performance Breaks Seven-Year Seasonal Trend
Bitcoin price performance during Q4 stands out for its historical weakness. The quarter is at present indicative of a drawdown of approximately 22.5. It is the lowest fourth quarter since 2018.
Such comparison is relevant because of the similarity in the market context. The two eras were preceded by long pre rallies. BTC price entered Q4 with limited upside elasticity.
Meanwhile, fourth quarters often reflect positioning resets rather than acceleration phases. This is the historical tendency of this year. Bitcoin price weakness does not indicate structural breakdown.
Nevertheless, it minimizes the chances of late-cycle growth. Consequently, the anticipations of a steep increase towards the end of the year seem to be exaggerated. The statistics rather favor a shift to early 2026.
🚨BITCOIN SET FOR ITS WEAKEST Q4 IN 7 YEARS#Bitcoin has recorded a -22.54% monthly return so far this quarter.
The last time Q4 was this weak was 2018, when $BTC posted a -42.16% monthly return. pic.twitter.com/7vZ1R0mcxQ
— Coin Bureau (@coinbureau) December 23, 2025
Summary
Bitcoin price action favors range continuation rather than a year-end breakout. BTC price faces firm resistance above $95,000 with limited time remaining. The low probability of a $100,000 print at the end of the year is supported by probability markets.
A potential retest of around 85,000 and stabilization is also supported by technical structure. Therefore, Bitcoin price appears positioned for consolidation. A long-term trend to $100,000 is likely to change to early 2026.
Play 10,000+ Casino Games at BC Game with Ease
- Instant Deposits And Withdrawals
- Crypto Casino And Sports Betting
- Exclusive Bonuses And Rewards

Frequently Asked Questions (FAQs)
1. What does Polymarket data indicate about market conviction?
2. Why does thin year-end liquidity matter for Bitcoin structure?
3. How does historical Q4 seasonality affect current expectations?

Why Trust CoinGape
CoinGape has covered the cryptocurrency industry since 2017, aiming to provide informative insights Read more…to our readers. Our journal analysts bring years of experience in market analysis and blockchain technology to ensure factual accuracy and balanced reporting. By following our Editorial Policy, our writers verify every source, fact-check each story, rely on reputable sources, and attribute quotes and media correctly. We also follow a rigorous Review Methodology when evaluating exchanges and tools. From emerging blockchain projects and coin launches to industry events and technical developments, we cover all facets of the digital asset space with unwavering commitment to timely, relevant information.

Related Articles


- Vitalik Buterin Maps Out Quantum Risks as Ethereum Foundation Unveils ‘Strawmap’
- BlackRock Adds $289M in BTC as Bitcoin ETFs Log 2-Week High Inflows Of $500M
- Glassnode Signals Bitcoin Still Faces Downside Risk Amid Massive Sell Pressure at $70K
- U.S House Introduces Bipartisan Crypto Bill To Protect Crypto Developers Amid DeFi Push Under CLARITY Act
- XRP News: Ripple Unveils Funding Hub To Support Innovation On XRPL
- Top 2 Price Predictions Ethereum and Solana Ahead of March 1 Clarity Act Stablecoin Deadline
- Pi Network Price Prediction Ahead of Protocol Upgrades Deadline on March 1
- XRP Price Outlook As Jane Street Lawsuit Sparks Shift in Morning Sell-Off Trend
- Dogecoin, Cardano, and Chainlink Price Prediction As Crypto Market Rebounds
- Will Solana Price Rally to $100 If Bitcoin Reclaims $72K?
- XRP Price Eye $2 Rebound as On-Chain Data Signals Massive Whale Accumulation


