
Will Bitcoin Price Hit $30000?; Long-term Trend Remains Bullish for $BTC


After witnessing sustained selling in the first two weeks of June, the Bitcoin price found suitable footing at combined support at $25000 and the lower trendline(red) of the wedge pattern. This boost in buying pressure triggered a relief rally in BTC price and surged the market value by 7% in just three days. Can this upswing initiate a sustained recovery and push the price back to $30000?
Also Read: Blackrock Stirs Bullish Momentum with Spot BTC ETF: $28,000 Bitcoin Price On The Horizon?
Bitcoin Price Daily Chart:
- The Bitcoin price rising for three consecutive days has reached the current trading price of $26726
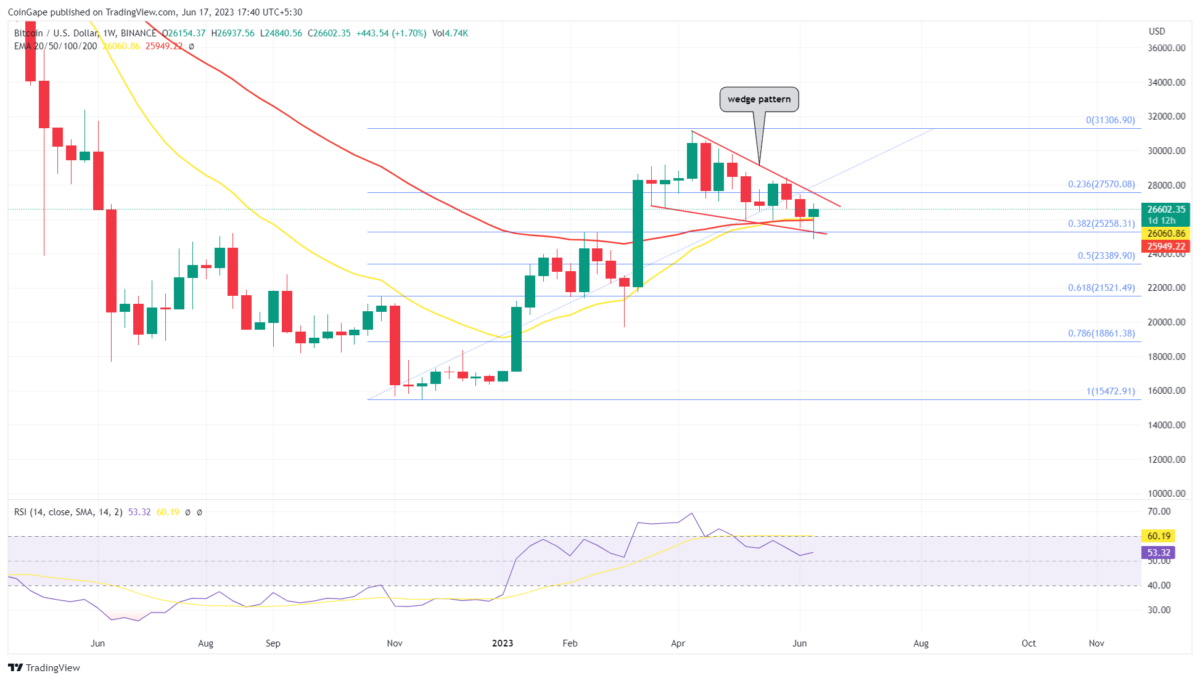
- A bullish crossover between the weekly 20 and 50 EMA flashes a buy signal for interested traders.
- The intraday trading volume in Bitcoin is $8.93 billion, indicating a 38% loss.
 (Source: Tradingview)
The weekly time frame chart shows the two monthly corrections in Bitcoin price are associated with weak volume activity. The downward price action backed by low volume reflects the lack of conviction from sellers which in contrast indicates the buyers are likely to retake trend control.
In addition, the correction phase is still above 50% Fibonacci retracement levels indicating the pullback is healthy in terms of overall bullish trend. As of now, a falling wedge pattern governs the ongoing downfall, and therefore a breakout above its resistance trendline will signal the resumption of prior recovery.
By the press time, the Bitcoin price traded at $26700, if the buyers gave a daily candle closing above the trendline, the potential buyers can look for an entry opportunity, with the expected rally to the $31555 mark.
Will Bitcoin Price Rise to the $31000 mark?
Amid the ongoing correction, the weekly chart shows alternative red and green candles reflecting no completion dominance from sellers. Thus, if the market sentiment shows improvement in the second half of June, the price could breach the overhead trendline. The post-breakout rally could push the price to $28500, followed by $29800 and $31155.
Play 10,000+ Casino Games at BC Game with Ease
- Instant Deposits And Withdrawals
- Crypto Casino And Sports Betting
- Exclusive Bonuses And Rewards


Why Trust CoinGape
CoinGape has covered the cryptocurrency industry since 2017, aiming to provide informative insights Read more…to our readers. Our journal analysts bring years of experience in market analysis and blockchain technology to ensure factual accuracy and balanced reporting. By following our Editorial Policy, our writers verify every source, fact-check each story, rely on reputable sources, and attribute quotes and media correctly. We also follow a rigorous Review Methodology when evaluating exchanges and tools. From emerging blockchain projects and coin launches to industry events and technical developments, we cover all facets of the digital asset space with unwavering commitment to timely, relevant information.


- BestChange.com Triples Referral Rewards in Major Program Overhaul
- FUNToken Launches First Mobile Game “Bounce Helix” on Android
- Breaking: Citigroup Cuts Bitcoin and Ethereum Price Targets amid CLARITY Act Delays
- Breaking: Bitcoin Treasury Metaplanet Moves 4986 BTC, Stock Price Tanks 12%
- Ripple News: XRPL Breaks Records with 7.7M Users Amid XRP Price Rally
- Bitcoin Price Forecast: Will BTC Break $80k Ahead of Fed Decision Today?
- MSTR Stock Prediction as Strategy Makes Largest Bitcoin Purchase in 2026 and Analyst Targets BTC Price $100K
- Pi Network Price Prediction After Smart Contract and Second Migration Launch
- Pepe Coin Price Surges 20%- How High Can it Go in March?
- Is XRP Price Gearing Up For $2 Level As BTC Rebounds Above $74k?
- Cardano’s $0.50 Resistance- Can “Midnight” Alpha Defy the Fog of War?


