Will $BNB Price Head to $200 Amid Market Sell-off?


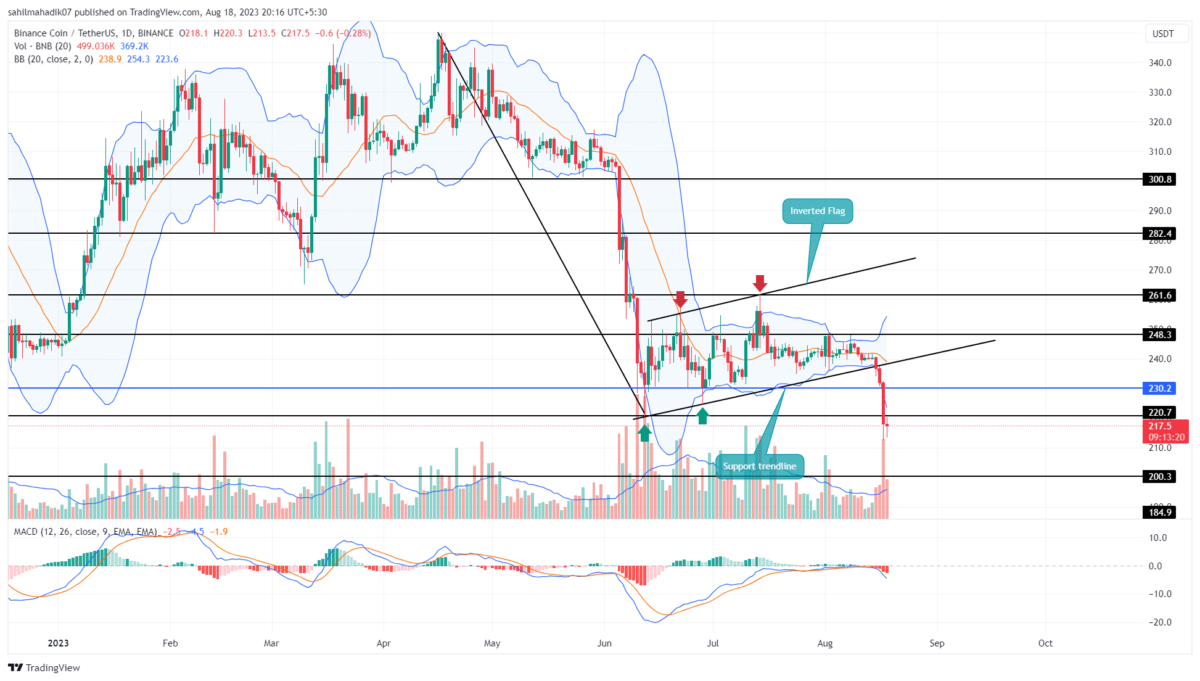
For over two months, the Binance coin price witnessed a slightly inclined trend as it resonated between the two trendlines of an inverted flag pattern. Amid the July-August correction in the crypto market, the sellers breached the pattern’s support trendline on August 15th. This breakdown signaled the continuation of the prevailing downtrend and plunged to a price below $220 support. Should you sell on this?
Also Read: Binance Loses Contract With UK’s Checkout.com
BNB Price Daily Chart: Key Points
- Completion of inverted flag pattern hints prolong correction in BNB Price
- A breakdown below $220 support triggers an 8% drop
- The intraday trading volume in the BNB coin is $888.4 Million, indicating an 80% gain
 Source- Tradingview
The cryptocurrency market experienced a notable bloodbath on August 17th, as the leading digital currency, Bitcoin, faced aggressive selling. This was likely instigated by SpaceX’s decision to divest its holdings in Bitcoin, creating a ripple effect of increased selling pressure throughout the crypto space. Consequently, Binance coin, the fourth largest cryptocurrency, saw a substantial outflow of funds and recorded a 5.99% intraday loss.
This drop has a high momentum breakdown below $220 support indicating the sellers obtained another resistance to pressurize buyers. By the press time, the BNB price trades at $218, with an intraday loss of 0.05%.
If the coin price shows sustainability below $220, the price will likely tumble another 8% to hit the $200 psychological level.
Can Binance Coin Make a Recovery Back to 230?
In the daily time frame chart, the BNB price shows two candles with lower price rejection near the $212 level. This demand pressure from below could trigger a minor pullback to test the breached support of $220. This retest will check price sustainability for interested short-sellers and offer new entry opportunities for them. However, in case the coin price breaks above $220, the anticipated pullback could reach $230.
- Bollinger Band: The coin price challenging the lower band Bollinger Band indicator reflects high momentum selling in the market.
- Moving Average Convergence Divergence: A negative crossover between the MACD+(blue) and Signal-(orange) slope signals a sustainable downtrend

Why Trust CoinGape
CoinGape has covered the cryptocurrency industry since 2017, aiming to provide informative insights Read more…to our readers. Our journal analysts bring years of experience in market analysis and blockchain technology to ensure factual accuracy and balanced reporting. By following our Editorial Policy, our writers verify every source, fact-check each story, rely on reputable sources, and attribute quotes and media correctly. We also follow a rigorous Review Methodology when evaluating exchanges and tools. From emerging blockchain projects and coin launches to industry events and technical developments, we cover all facets of the digital asset space with unwavering commitment to timely, relevant information.

Related Articles


- Trump Tariffs: U.S. Threatens Higher Tariffs After Supreme Court Ruling, BTC Price Falls
- Fed’s Chris Waller Says Support For March Rate Cut Will Depend On Jobs Report
- Breaking: Tom Lee’s BitMine Adds 51,162 ETH Amid Vitalik Buterin’s Ethereum Sales
- Breaking: Michael Saylor’s Strategy Makes 100th Bitcoin Purchase, Buys 592 BTC as Market Struggles
- Satoshi-Era Whale Dumps $750M BTC as Hedge Funds Pull Out Billions in Bitcoin
- Top 3 Meme Coins Price Prediction As BTC Crashes Below $67k
- Top 4 Reasons Why Bitcoin Price Will Crash to $60k This Week
- COIN Stock Price Prediction: Will Coinbase Crash or Rally in Feb 2026?
- Shiba Inu Price Feb 2026: Will SHIB Rise Soon?
- Pi Network Price Prediction: How High Can Pi Coin Go?
- Dogecoin Price Prediction Feb 2026: Will DOGE Break $0.20 This month?


