 Buy $GGs
Will Bone Price Reclaim $2 Mark Before August End?


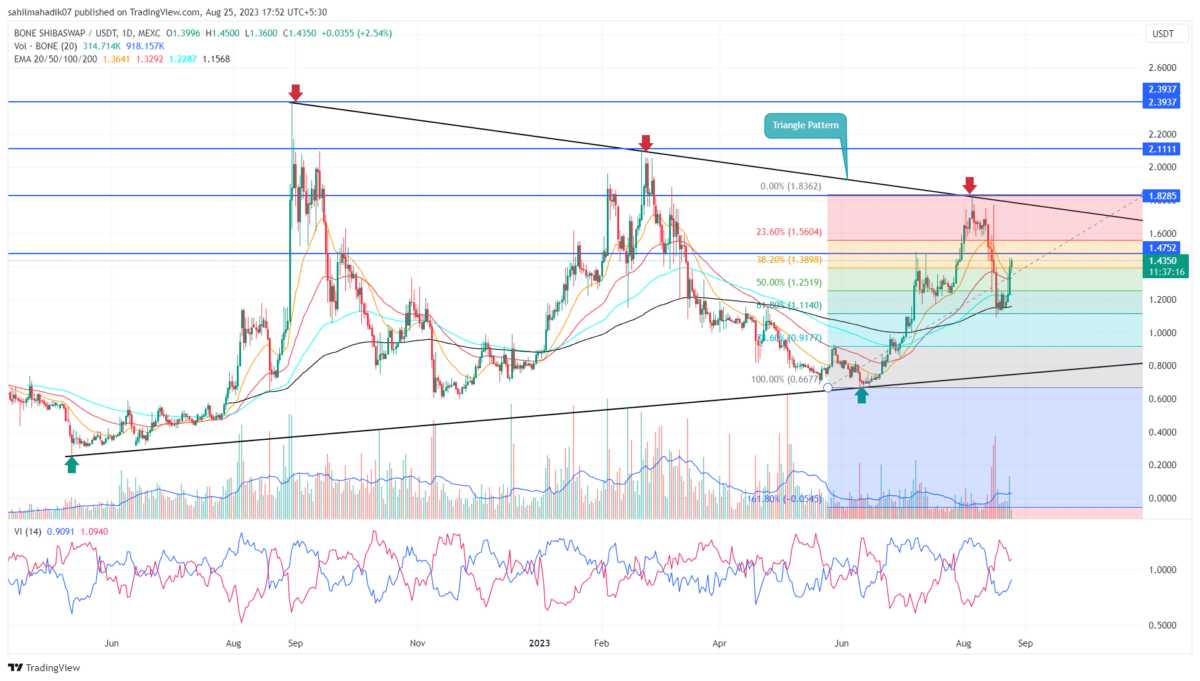
For the past 15 months, the BONE ShibaSwap coin has adhered to a sideways trend, encapsulated within the confines of a symmetrical triangle pattern. A key characteristic of this pattern is its ability to restrain price fluctuations within two converging trend lines. Notably, the BONE price has rebounded twice from the lower trendline and thrice from the upper trendline, underscoring the pattern’s substantial impact on influencing price behavior. Here’s how the chart setup may assist in predicting near-future trends.
Also Read: BTC, ETH, BONE, and DYDX Prices Surge Ahead of Key Fed Talk
Bone Daily Chart: Key Points
- A breakout above $1.47 sets the coin price for an 18% rally.
- Until the triangle pattern is intact, the BONE ShibaSwap coin may prolong the sideways trend
- The intraday trading volume of the Bone ShibaSwap token is $22.7 Million, showing a 59% gain.
 Source- Tradingview
Amid the August month correction, the BONE price faced a downturn. Following its high of $1.82, the price experienced a sharp decline of 39%, plummeting to a low of $1.1.
In the midst of prevailing uncertainty within the broader crypto market, the BONE price found support at the 61.8% Fibonacci retracement level. This marked a pivotal turning point as the price surged by 26.5%, ultimately settling at its current valuation of $1.39.
Should the current bullish momentum persist, market participants can anticipate the possibility of breaching the overhead resistance at $1.47. A successful breakout could propel the BONE price by 18%, positioning it to challenge the upper trendline of the symmetrical triangle pattern. A successful breach of this barrier would signal a promising shift toward a new bull trend, potentially hitting the early targets of $2.1, Followed by $2.39
Will Bone Price Resume Correction Trend?
While the BONE price exhibits upward momentum, it is essential to recognize the impending resistance at the upper trendline of the symmetrical triangle pattern. The anticipated supply pressure at this juncture could potentially impede further immediate advances. Should weakness persist within the market sentiment, this memecoin could experience a bearish reversal from the dynamic resistance and trigger a new correction trend.
- Vortex Indicator: The V+(blue) and VI-(orange) slope nearing a bullish crossover reflect the increased buying momentum.
- EMAs: The 200-day EMA waving in a lateral path accentuates a sideway trend in BONE.
Play 10,000+ Casino Games at BC Game with Ease
- Instant Deposits And Withdrawals
- Crypto Casino And Sports Betting
- Exclusive Bonuses And Rewards


Why Trust CoinGape
CoinGape has covered the cryptocurrency industry since 2017, aiming to provide informative insights Read more…to our readers. Our journal analysts bring years of experience in market analysis and blockchain technology to ensure factual accuracy and balanced reporting. By following our Editorial Policy, our writers verify every source, fact-check each story, rely on reputable sources, and attribute quotes and media correctly. We also follow a rigorous Review Methodology when evaluating exchanges and tools. From emerging blockchain projects and coin launches to industry events and technical developments, we cover all facets of the digital asset space with unwavering commitment to timely, relevant information.

Related Articles


- Bitcoin Price Still Risks Decline If Iran War Mirrors Ukraine War Market Reaction, JPMorgan Warns
- Bitget Unveils Upgrade For Stock, Gold Trading Alongside Crypto As Part Of Universal Exchange Push
- ChangeNOW Is Settling Crypto Swaps in Under a Minute.
- $3B Western Union Expands Into Crypto With USDPT Stablecoin Launch on Solana
- XRP News: Key Ripple Whale Indicator Turns Bullish After Months, Price Rally Ahead?
- Pi Network Price As BTC Rallies Above $74K: Can PI Coin Extend Gains to $0.30?
- XRP Price As Bitcoin Reclaims $74K- Is $5 Next?
- Dogecoin Price Outlook as BTC Recovers Above $73,000
- XRP Price Prediction as Iran-U.S. Peace Talks Trigger a Crypto Rally
- COIN Stock Analysis as Bitcoin Retests $72k Ahead of February NFP Data
- Robinhood Stock Price Prediction As Cathie Wood Buys $12M Dip in Bold ARK Move


