Will BTC Price Extend Correction Trend below $27000?


On August 17th, the cryptocurrency market encountered a substantial wave of selling with Bitcoin leading the downward charge. This notable sell-off was triggered by SpaceX’s announcement to divest its Bitcoin holdings, effectively magnifying the selling pressure across the crypto landscape. Thus, the BTC price showcased a 7% intraday loss leading to a breakdown below the multi-month support trendline. This breach signals the possibility of an extended correction phase for the largest cryptocurrency
Also Read: BTC Price Dump Far From Over, Sub $20k Crash Incoming?
Bitcoin Daily Chart: Key Points
- Within a fortnight, the BTC price plunged from the $30789 upswing to the current price of $26462 registering a 14.4% loss
- The Bitcoin fear and greed index at 39% reflects negative sentiment among traders
- The intraday trading volume in Bitcoin is $17.4 Billion, indicating a 49% loss.
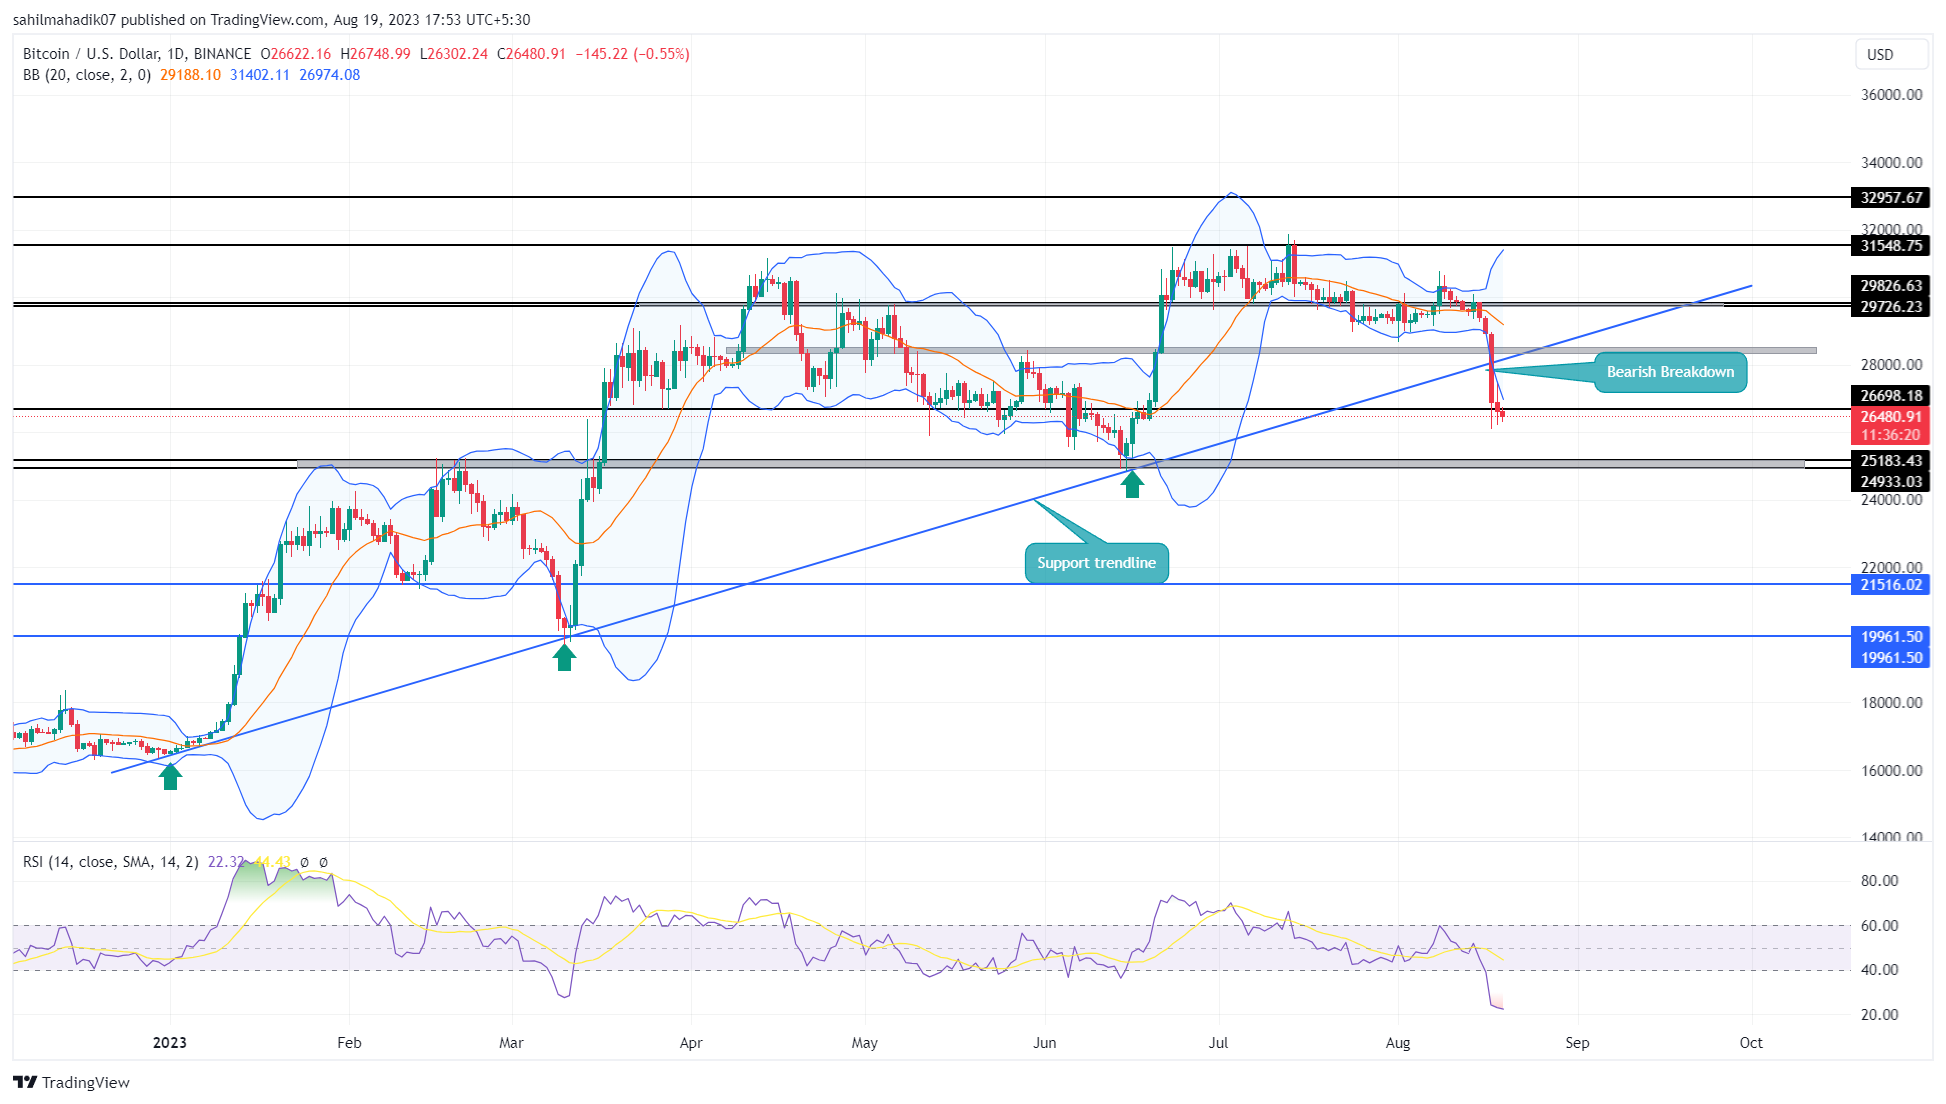 Source- Tradingview
Over the course of the past nine months, BTC price enjoyed a robust uptrend bolstered by an ascending support trendline. Throughout this period, the lower trendline acted as a stronghold for buyers, encouraging accumulation during price dips.
However, the equilibrium was disrupted on August 17th when Bitcoin suffered a 7% decline and pierced through the dynamic support. This breakdown has the potential to shift market sentiment from a “buying on dips” approach to a “selling on rallies” strategy.
Should the coin price manage to maintain its position below the breached support, the mounting selling pressure could propel Bitcoin value toward critical support levels at $25000 and subsequently $21500. A breakdown below the $25000 swing low would signal the seller undermined the principle of Dow theory and also provide further affirmation of a prolonged period of decline.
[converter id=”btc-bitcoin” url=”https://coingape.com/price/converter/btc-to-usd/”]
Right Time to Short Bitcoin?
Given this backdrop, a minor pullback in BTC price is anticipated. This correction could potentially facilitate a retest of the breached support trendline. However, the sustainability of the coin price below the ascending trendline could present an attractive short-selling opportunity for traders who are keen on capitalizing on the prevailing downward momentum.
- Bollinger Band: An downslope in the lower band on the Bollinger band indicator reflects high momentum selling in this coin
- Relative Strength Index: The daily RSI slope at 21% reflects an oversold Bitcoin value and a high possibility of a bullish pullback.

Why Trust CoinGape
CoinGape has covered the cryptocurrency industry since 2017, aiming to provide informative insights Read more…to our readers. Our journal analysts bring years of experience in market analysis and blockchain technology to ensure factual accuracy and balanced reporting. By following our Editorial Policy, our writers verify every source, fact-check each story, rely on reputable sources, and attribute quotes and media correctly. We also follow a rigorous Review Methodology when evaluating exchanges and tools. From emerging blockchain projects and coin launches to industry events and technical developments, we cover all facets of the digital asset space with unwavering commitment to timely, relevant information.

Related Articles


- Bitcoin Sell-Off Ahead? Garett Jin Moves $760M BTC to Binance Amid Trump’s New Tariffs
- CLARITY Act: Trump’s Crypto Adviser Says Stablecoin Yield Deal Is “Close” as March 1 Deadline Looms
- Trump Tariffs: U.S. To Impose 10% Global Tariff Following Supreme Court Ruling
- CryptoQuant Flags $54K Bitcoin Risk As Trump Considers Limited Strike On Iran
- Why Is Bitdeer Stock Price Dropping Today?
- Ethereum Price Rises After SCOTUS Ruling: Here’s Why a Drop to $1,500 is Possible
- Will Pi Network Price See a Surge After the Mainnet Launch Anniversary?
- Bitcoin and XRP Price Prediction As White House Sets March 1st Deadline to Advance Clarity Act
- Top 3 Price Predictions Feb 2026 for Solana, Bitcoin, Pi Network as Odds of Trump Attacking Iran Rise
- Cardano Price Prediction Feb 2026 as Coinbase Accepts ADA as Loan Collateral
- Ripple Prediction: Will Arizona XRP Reserve Boost Price?


