 Buy $GGs
Will BTC Price Regain $28000 Before August End?


After the massive dump on August 17th, the largest cryptocurrency Bitcoin has witnessed high volatility for nearly two weeks. While the downward projection continues, the daily candle shows a long-wick rejection on either side, reflecting uncertainty in bearish momentum. Will this indecisiveness lead to a bullish pullback or it’s a small breather for prolonged correction?
Also Read: Pro-Bitcoin DeSantis Rises As Champion After GOP Debate; Trump Still Leads
Bitcoin Daily Chart: Key Points
- A bullish breakout from the chart pattern will set an 8% price jump
- The Bitcoin fear and greed index at 38% reflects bearish sentiment among market participants
- The intraday trading volume in Bitcoin is $6.2 Billion, indicating a 30% loss.
 Source- Tradingview
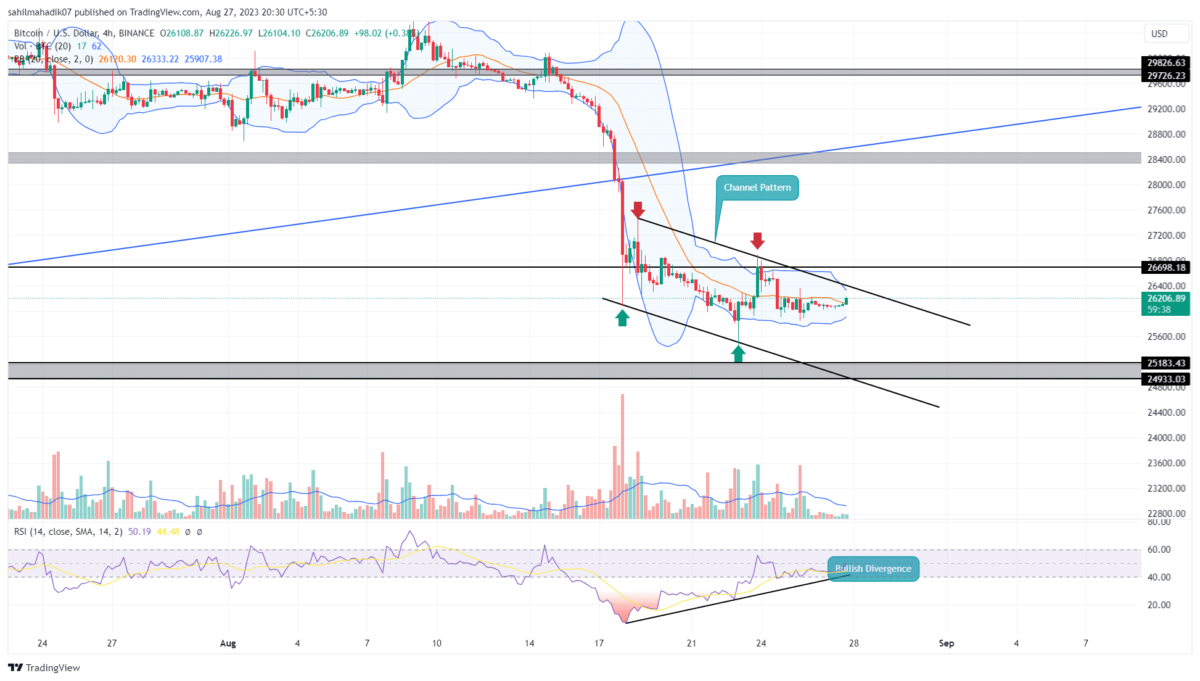
The 4-hour time frame chart shows the ongoing downtrend in a more stable manner wobbling between two parallel walking trendlines. This price behavior reflects the formation of a known bullish reversal pattern called the falling parallel channel.
By the press time, the Bitcoin price traded at $26166 with an intraday gain of 0.32%. This uptick will lead the coin price back to the overhead trendline with a potential bullish breakout. Anyhow, after a massive downfall, the asset price tends to show a minor pullback in order to stabilize the prevailing downtrend.
A 4-hour candle closing above the upper trendline will kickstart this anticipated bullish pullback. The post-breakout rally will push the prices 8% higher and retest the $28500 barrier.
The crypto holders must be cautious at this barrier as with the overall trend still negative, the sellers could recuperate bearish momentum for prolonged correction.
[converter id=”btc-bitcoin” url=”https://coingape.com/price/converter/btc-to-usd/”]
Will BTC Price Fall Back to $25000?
While the possibility of a bullish reversal seems valid, the two trendlines are currently leading to the ongoing downfall. Until the two trend lines are intact, the BTC price may extend the downward march. A potential reversal from this upper trendline will trigger a new bear cycle within the channel and lead the prices back to $25000.
- Bollinger Band: The narrowing range on the Bollinger Band indicator shows high volatility in the market.
- Relative Strength Index: Contrary to the falling price, the RSI slope shows an evident rise reflecting growing bullish momentum.
Play 10,000+ Casino Games at BC Game with Ease
- Instant Deposits And Withdrawals
- Crypto Casino And Sports Betting
- Exclusive Bonuses And Rewards


Why Trust CoinGape
CoinGape has covered the cryptocurrency industry since 2017, aiming to provide informative insights Read more…to our readers. Our journal analysts bring years of experience in market analysis and blockchain technology to ensure factual accuracy and balanced reporting. By following our Editorial Policy, our writers verify every source, fact-check each story, rely on reputable sources, and attribute quotes and media correctly. We also follow a rigorous Review Methodology when evaluating exchanges and tools. From emerging blockchain projects and coin launches to industry events and technical developments, we cover all facets of the digital asset space with unwavering commitment to timely, relevant information.

Related Articles


- Peter Schiff Predicts BTC to Fall, Gold to Rise as Markets Price in Prolonged Iran War
- Institutional Re-Accumulation Signs Emerge as Bitcoin ETFs See $1.1B Net Inflows Since Iran War Began: Glassnode
- From Mining Pool to Infrastructure Platform: Nine Years of EMCD
- U.S.-Iran War: U.S. Oil Prices Spike To One-Year High, Bitcoin and Gold Dip
- Crypto Traders Bet Against U.S.-Iran Ceasefire This Month as Iran Denies Peace Talks
- HOOD Stock Targets $100 as Robinhood Unveils Platinum Card and Advance Dividend Feature
- Bitcoin Price Prediction if Donald Trump Signs the CLARITY Act on April 3, 2026
- Pi Network Price As BTC Rallies Above $74K: Can PI Coin Extend Gains to $0.30?
- XRP Price As Bitcoin Reclaims $74K- Is $5 Next?
- Dogecoin Price Outlook as BTC Recovers Above $73,000
- XRP Price Prediction as Iran-U.S. Peace Talks Trigger a Crypto Rally


