 Buy $GGs
Will EMA Death Crossover Lead ETH Price to $1500?


The recent surge in the crypto market linked to the bullish sentiment built around the Bitcoin ETF was immediately undermined by sellers. The bears struck a counterattack with even greater force leading to a significant downfall in the top two cryptocurrencies Bitcoin and Ethereum. Amid this downfall, the ETH price lost a significant local support of $1610 suggesting further downfall in the near term.
Also Read: ETH Price Prediction: Traders Moving Ethereum At Major Loss Ratio A Bullish Signal?
ETH Price Below Key Support Hints Further Downfall
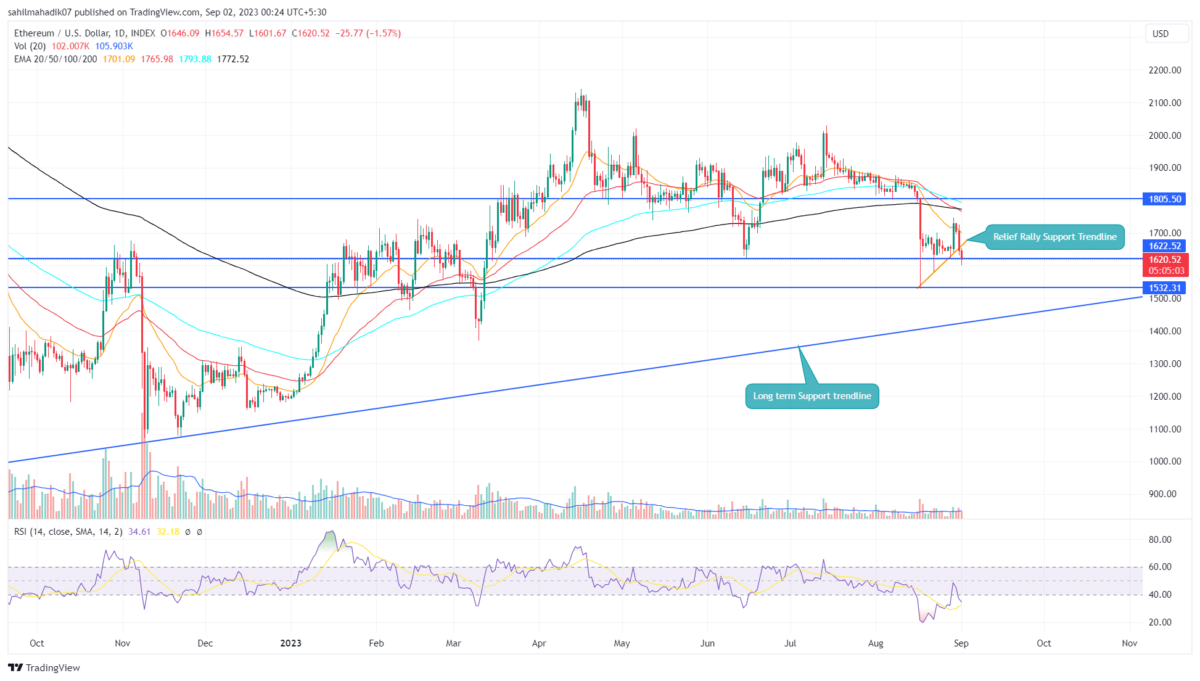
- A bearish breakdown below the support trendline hints at a sharp 10% drop
- The ETH price below daily(20, 50, 100, and 200) accentuates the overall trend is bearish
- The intraday trading volume in Ether is $16.5 Billion, indicating a 9% gain.
 Source- Tradingview
In the last two weeks, the Ethereum price showed a minor pullback in the daily chart under the influence of an ascending trendline. The dynamic support bolstered the coin price to a high of $1760.6, after which the bullish sentiment around Bitcoin ETF faded, leading to a sharper downfall.
The ETH price fell for three consecutive days registered 7.22% and currently trading at $1605. Amidst this downfall, the coin price breached the combined support of $1610 and the aforementioned support trendline.
Losing this support provides sellers with an extra edge to pressure the altcoin for lower levels. If the prices show sustainability below the pierced levels, the downward trendline will hit $1532 support followed by a $1500, reflecting a potential loss of 10%.
[converter id=”eth-ethereum” url=”https://coingape.com/price/converter/eth-to-usd/?amount=1″]
Is Ethereum Coin Bullish Trend Still on Track?
While the bearish movement seems reasonable for the Ethereum coin, the anticipated downfall to $1500 may hit a long-coming support trendline. This yearly support drives the long-term uptrend for this second-largest cryptocurrency, offering an excellent footing to accumulate in market dips.
However, a breakdown below the trendline will trigger a major correction for Ether.
Play 10,000+ Casino Games at BC Game with Ease
- Instant Deposits And Withdrawals
- Crypto Casino And Sports Betting
- Exclusive Bonuses And Rewards


Why Trust CoinGape
CoinGape has covered the cryptocurrency industry since 2017, aiming to provide informative insights Read more…to our readers. Our journal analysts bring years of experience in market analysis and blockchain technology to ensure factual accuracy and balanced reporting. By following our Editorial Policy, our writers verify every source, fact-check each story, rely on reputable sources, and attribute quotes and media correctly. We also follow a rigorous Review Methodology when evaluating exchanges and tools. From emerging blockchain projects and coin launches to industry events and technical developments, we cover all facets of the digital asset space with unwavering commitment to timely, relevant information.

Related Articles


- Core Scientific Sells 1,900 BTC as Bitcoin Miner Pivots to AI, CORZ Stock Dips
- Bitcoin News: VanEck CEO Projects Gradual BTC Rally in 2026 as ETFs Sees $458M Inflows
- Bitcoin, Gold Slip as Donald Trump Says “Unlimited Munition Stockpiles” for US-Iran War
- Crypto Prices Today: BTC, ETH, XRP Prices Surge Despite Iran’s Strait of Hormuz Closure
- Nasdaq Brings Prediction Markets to Wall Street with New SEC Filing
- Bitcoin Price Prediction as US-Iran War Enters 4th Consecutive Day
- Top 5 Historical Reasons Dogecoin Price Is Not Rising
- Pi Coin Price Prediction for March 2026 Amid Network Upgrade, KYC Boost, Rewards Distribution
- Gold Price Nears ATH; Silver Eyes $100 Breakout on Us- Iran War
- Bitcoin And XRP Price As US Kills Iran Supreme Leader- Is A Crypto Crash Ahead?
- Gold Price Prediction 2026: Analysts Expect Gold to Reach $6,300 This Year


