 Buy $GGs
Will Internet Computer Price Hit $20? Chart Pattern Provides Insight


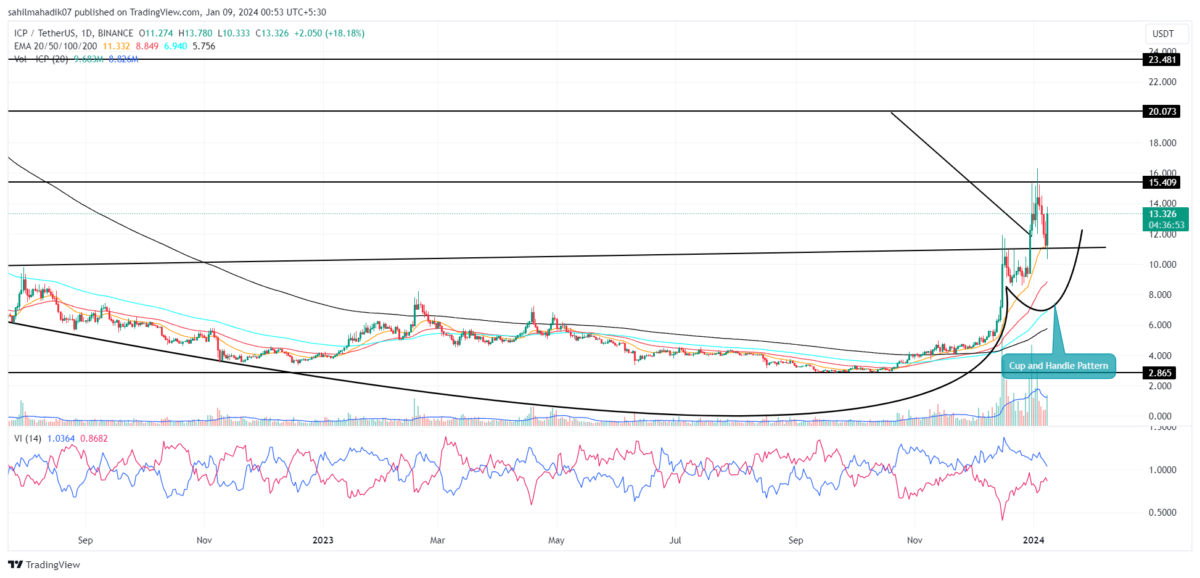
The Internet Computer (ICP) price recently experienced a notable pullback, dropping from a high of $16.3 to a low of $10.3, a 36.6% decline. This decrease coincided with low transaction volumes, suggesting it might be a short-term correction rather than a long-term trend reversal. Currently, the ICP price is testing the support level of a previously breached ‘cup and handle’ pattern, which could indicate an opportune moment for traders to enter the market.
Is ICP Price Heading to $15?
- A bullish reversal from the $11 mark with an engulfing candle signals an uptrend continuation.
- The ICP price above daily EMAs(20, 50, 100, and 200) indicate an aggressive uptrend
- The intraday trading volume in ICP is $10.2 Billion, indicating a 78% gain.

On the daily time frame chart, the Internet Computer coin displays a bullish reversal ‘Cup-and-Handle’ formation that has been developing over the last 18 months. This pattern is a crucial indicator for market accumulation, potentially signaling a major shift in trend direction.
The recovery trend, which began in mid-October, saw the coin’s price escalate dramatically from $2.9 to $16.3, marking a 457% increase. This surge resulted in a decisive breakout from the neckline resistance of the pattern on December 30th, suggesting the coin is moving out of a prolonged accumulation phase and could be primed for a significant breakout.
Last week’s pullback to the $11 level appears to be a retest of the breached neckline, now serving as a support level. The subsequent 15% increase in price today indicates active accumulation by buyers at these lower levels, reinforcing the likelihood of a sustained uptrend.
If the ‘Cup-and-Handle’ pattern continues to hold, there’s potential for the ICP price to increase by an additional 56%, possibly reaching the key psychological threshold of $20.
Volume Tells Tale of Sustainable Recovery
In a recent X(formerly Twitter) post, the renowned trader Jim Roppel highlighted an interesting volume-price action relationship in ICP price. He mentioned the asset with super low volume during the pullback, while a significant surge in trading during the rise as happened today with an intraday gain of 20%
This pattern indicates the traders are less interested in trading this asset for short selling, and more focused and confident in long entry opportunities.
- Exponential Moving Average: The 20-day EMA provides suitable pullback support for buyers.
- Vortex Indicator: A bullish crossover state between the VI+ and VI0 slope reflects a recovery trend in active.
Related Articles:
Play 10,000+ Casino Games at BC Game with Ease
- Instant Deposits And Withdrawals
- Crypto Casino And Sports Betting
- Exclusive Bonuses And Rewards


Why Trust CoinGape
CoinGape has covered the cryptocurrency industry since 2017, aiming to provide informative insights Read more…to our readers. Our journal analysts bring years of experience in market analysis and blockchain technology to ensure factual accuracy and balanced reporting. By following our Editorial Policy, our writers verify every source, fact-check each story, rely on reputable sources, and attribute quotes and media correctly. We also follow a rigorous Review Methodology when evaluating exchanges and tools. From emerging blockchain projects and coin launches to industry events and technical developments, we cover all facets of the digital asset space with unwavering commitment to timely, relevant information.
Internet Computer
24 Hours volume
$70.83M
Market Cap
$1.35B
Max Supply
469.21M

Related Articles


- US-Iran War: Reports Confirm Bombings In UAE, Bahrain and Kuwait As Crypto Market Makes Recovery
- XRP Price Dips on US-Iran Conflict, But Capitulation Signals March Rebound
- Crypto Market at Risk as U.S.–Iran War Threatens Inflation With Oil Price Surge
- Polymarket U.S.–Iran Strike Bets Fuel Insider Trading Speculation as Crypto Traders Net $1.2M
- Cardano’s DeFi TVL Climbs as USDCx Stablecoin Launches on Network
- Top Analyst Predicts Pi Network Price Bottom, Flags Key Catalysts
- Will Ethereum Price Hold $1,900 Level After Five Weeks of $563M ETF Selling?
- Top 2 Price Predictions Ethereum and Solana Ahead of March 1 Clarity Act Stablecoin Deadline
- Pi Network Price Prediction Ahead of Protocol Upgrades Deadline on March 1
- XRP Price Outlook As Jane Street Lawsuit Sparks Shift in Morning Sell-Off Trend
- Dogecoin, Cardano, and Chainlink Price Prediction As Crypto Market Rebounds


