Will Pepe Coin (PEPE) Price Reclaim $0.00000155 Milestone?


In the daily time frame chart, the Frog-themed pepe coin shows a V-shaped recovery from the combined support of $0.00000105 and 78.6% Fibonacci retracement level. This bullish upswing is likely associated with the formation of a bullish reversal pattern called an ending diagonal. The rising price recently breached a local resistance of $0.00000131 indicating the potential for higher gains.
Also Read: Dogecoin, Shiba Inu, ApeCoin, PEPE Finally Decoupling From Bitcoin?
Pepe coin Price Daily Chart
- A bullish breakout from the $0.00000131 resistance set the PEPE price for a 14.2% rally
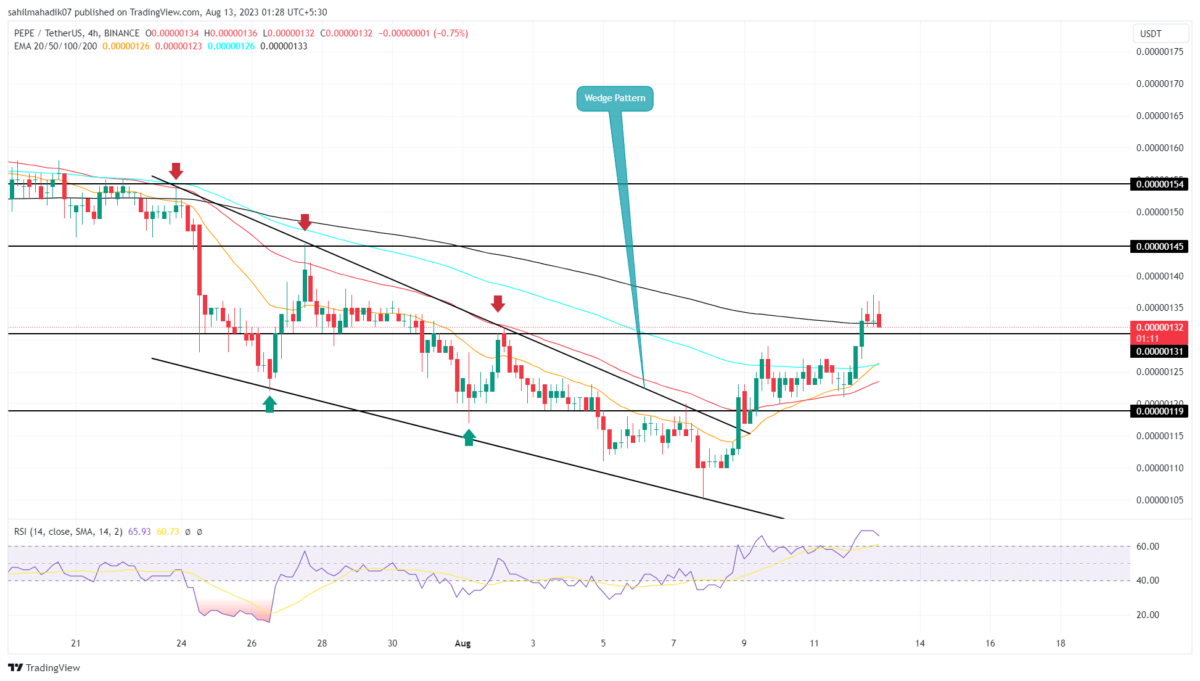
- The coin price trading above the 4-hour EMAs(20, 50, 100, and, 200) reflects the short-term trend as bullish
- The 24-hour trading volume in the Pepecoin coin is $107.5 Million, indicating a 42.5 % loss.
 Source- Tradingview
On August 8th, the Pepe coin price gave a decisive breakdown from the resistance trendline falling wedge pattern. The breakout intensified the buying momentum and pushed the prices 13.6% higher in the last four days.
Amid this rally, the buyers gave a high momentum breakout from the local resistance of $0.00000131. By the press time, the PEPE price trades at $0.00000132 and may see a pullback to retest the breached barrier.
If the coin price shows sustainability above $0.00000131 flipped support, the buyers may continue with the path of a wedge pattern. With sustained buying, the Pepecoin price should rise 16.2% to hit $0.00000155.
Will Pepe coin Witness a Pullback?
The 4-hour time frame chart shows multi-higher wick rejection candles near the $0.00000135 barrier. This overhead supply would trigger a significant pullback which may assist buyers to recuperate exhausted bullish momentum. However, if the minor downtick sustains above the $0.00000129 midpoints of the August 12th daily candle, the bullish thesis will remain aggressive.
- Fibonacci Retracement Level: The pepecoin price correction found a suitable support level of 78.6%. FIB level
- Relative Strength Index: The RSI slope above 70% reflects a high momentum uptrend.

Why Trust CoinGape
CoinGape has covered the cryptocurrency industry since 2017, aiming to provide informative insights Read more…to our readers. Our journal analysts bring years of experience in market analysis and blockchain technology to ensure factual accuracy and balanced reporting. By following our Editorial Policy, our writers verify every source, fact-check each story, rely on reputable sources, and attribute quotes and media correctly. We also follow a rigorous Review Methodology when evaluating exchanges and tools. From emerging blockchain projects and coin launches to industry events and technical developments, we cover all facets of the digital asset space with unwavering commitment to timely, relevant information.

Related Articles


- XRP Realized Losses Spike to Highest Level Since 2022, Will Price Rally Again?
- Crypto Market Rises as U.S. and Iran Reach Key Agreement On Nuclear Talks
- Trump Tariffs: U.S. Raises Global Tariff Rate To 15% Following Supreme Court Ruling
- Bitwise CIO Names BTC, ETH, SOL, and LINK as ‘Mount Rushmore’ of Crypto Amid Market Weakness
- Prediction Market News: Kalshi Faces New Lawsuit Amid State Regulatory Crackdown
- Dogecoin Price Prediction Feb 2026: Will DOGE Break $0.20 This month?
- XRP Price Prediction As SBI Introduces Tokenized Bonds With Crypto Rewards
- Ethereum Price Rises After SCOTUS Ruling: Here’s Why a Drop to $1,500 is Possible
- Will Pi Network Price See a Surge After the Mainnet Launch Anniversary?
- Bitcoin and XRP Price Prediction As White House Sets March 1st Deadline to Advance Clarity Act
- Top 3 Price Predictions Feb 2026 for Solana, Bitcoin, Pi Network as Odds of Trump Attacking Iran Rise


