 Buy $GGs
Will This Bullish Pattern Boost Solana Price To $48


The Solana (SOL) price displays a bullish reversal opportunity with a double bottom pattern at the psychological Mark of $30. However, the declining 50-day EMA opposes the bullish growth to reach the neckline at $38. So, should you consider taking a bullish trade or wait until prices exceed $38?
Key points From SOL Technical Analysis:
- The Solana price rose 10% in the last 48 hours.
- The daily-RSI slope spikes slightly above the halfway line reflecting.
- The 24-hour trading volume in the Solana coin is $1.04 Billion, indicating a 19% gain.

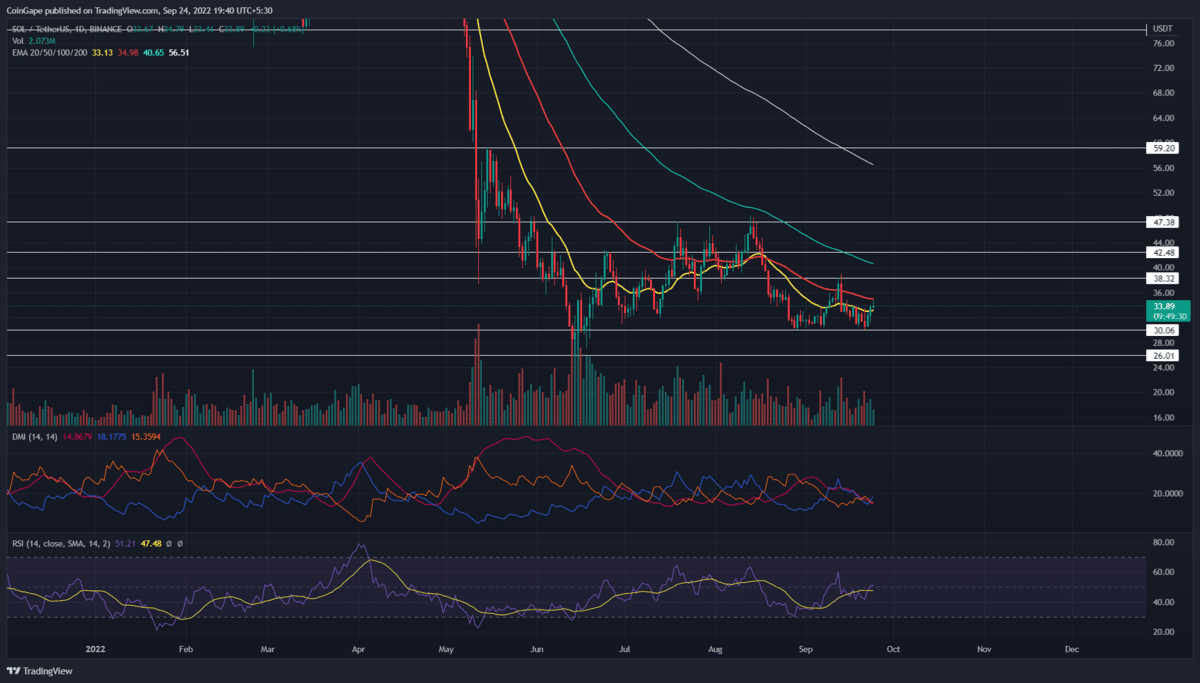
Source-Tradingview
During the last few bearish weeks, the SOL/USDT chart shows the Solana market price declined sharply to reach the bottom crucial support level at $30. The correction coincides with a reversal from the 100-day EMA accounting for a bear cycle of 20%, undermining the previous recovery rally seen in July.
The bear cycle, however, fails to break the psychological Mark of $30, leaving a consolidation with the overhead resistance of $38. Additionally, the bullish resurfacing influence over the consolidation range teases a double bottom which generally forecasts a reversal from a notion formed at a solid base level.
The consolidation’s ceiling at $38 acts as the neckline of the bullish pattern and the recent reversal of 10% over the last two days cements the idea of a trend reversal. Hence, optimistic swing traders can find buying opportunities at the current market price.
However, the traders waiting for a breakout entry opportunity will have to be patient till the Solana market price surpasses the $38 neckline. The bullish pattern gives the next target as the $47 horizontal level.
However, considering the reversal rally fails to exceed the 50-day EMA, the double bottom theory will be nullified, potentially leading to a drop to $30.
Technical indicator
The rising RSI slope peaks above the halfway line supporting the bullish reversal theory by indicating a rise in the underlying bullishness. However, the sideways trend in the midterm reflects a bullish turmoil over the trend control.
The declining trend in the crucial daily EMAs displays an overall downtrend, with the 50-day EMA providing resistance to the recovery rally.
- Resistance level- $38 and $47.2
- Support levels- $30 and $25
Play 10,000+ Casino Games at BC Game with Ease
- Instant Deposits And Withdrawals
- Crypto Casino And Sports Betting
- Exclusive Bonuses And Rewards


Why Trust CoinGape
CoinGape has covered the cryptocurrency industry since 2017, aiming to provide informative insights Read more…to our readers. Our journal analysts bring years of experience in market analysis and blockchain technology to ensure factual accuracy and balanced reporting. By following our Editorial Policy, our writers verify every source, fact-check each story, rely on reputable sources, and attribute quotes and media correctly. We also follow a rigorous Review Methodology when evaluating exchanges and tools. From emerging blockchain projects and coin launches to industry events and technical developments, we cover all facets of the digital asset space with unwavering commitment to timely, relevant information.

Related Articles


- Senate Eyes CLARITY Act Markup This Month as Banks, Crypto Continue Stablecoin Yield Talks
- Why XRP Price Rising Today? (2 March)
- Breaking: Bitcoin Price Rises to $70k as Gold Crashes Amid U.S.-Iran Conflict
- Bitcoin News: Anthony Pompliano’s ProCap Buys 450 BTC, Gold Bug Peter Schiff Reacts
- Fed Rate Cuts More Likely If U.S.-Iran Conflict Extends, Arthur Hayes Predicts
- Top 5 Historical Reasons Dogecoin Price Is Not Rising
- Pi Coin Price Prediction for March 2026 Amid Network Upgrade, KYC Boost, Rewards Distribution
- Gold Price Nears ATH; Silver Eyes $100 Breakout on Us- Iran War
- Bitcoin And XRP Price As US Kills Iran Supreme Leader- Is A Crypto Crash Ahead?
- Gold Price Prediction 2026: Analysts Expect Gold to Reach $6,300 This Year
- Circle (CRCL) Stock Price Prediction as Today is the CLARITY Act Deadline


