
Will This Bullish Pattern Release MATIC Price From Long-Coming Consolidation?


In response to the overall downtrend in the crypto market, the Polygon coin price restricted its bullish growth and walked a sideways trend for the past six months. However, during this consolidation, the price rebounded from the $0.76 support multiple times, validating this level as a high accumulation zone. Therefore, using the aforementioned level as a base support, the MATIC price shows the formation of a double bottom pattern. This pattern formation accentuates the price sustainability above a specific horizontal level and replenishes the bullish momentum for potential price recovery.
Key points
- The $0.87 breakout could drive the MATIC price 12.5% higher to reach $0.953
- The 200-day EMA wavering near the $0.888 mark will try to stall the potential price rally.
- The intraday trading volume in the MATIC is $1.35 Billion, indicating a 36.2% gain.
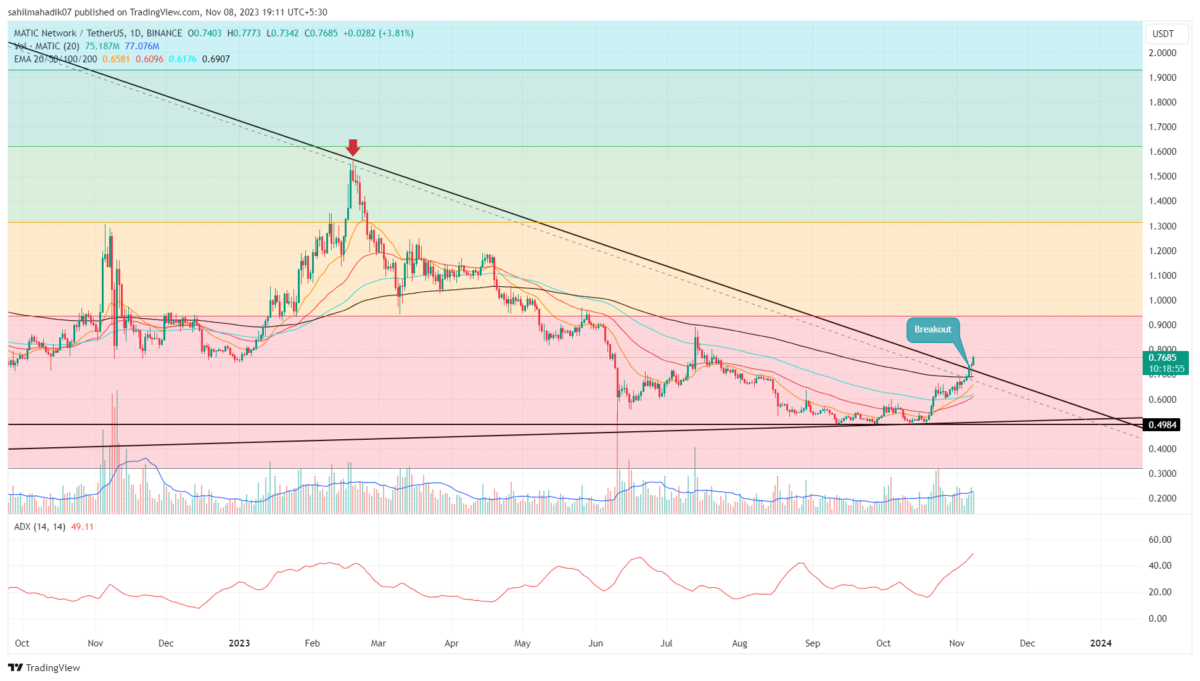
 Source- –Tradingview
Amidst the recent new year recovery in the crypto market, the MATIC price rebounded from the $0.76 support and surged 14.6% higher. By press time, this altcoin traded at the $0.85 mark and showed a power struggle to break the $0.87 barrier.
Thus, a possible post-rally pullback may tumble the prices by 4% down to $0.816 local support. However, under the influence of a bullish reversal pattern, the MATIC price should witness a sustained rally to the $0.95 mark.
Also Read: Top Crypto Marketing Firms / Agencies 2023; Here’s Best Picks
The $0.95 is the neckline of the mentioned pattern, and its breakout will intensify the bullish momentum. As per the technical setup, the post-breakout rally travels the same distance as the length between the base support and neckline, shot from the breakout points.
Therefore, a breakout from the $0.95 barrier will drive the MATIC price 35% higher to reach the $1.15 mark.
Conversely, a breakdown from the $0.816 support invalidates the bullish thesis.
Technical Indicators
Bollinger Band: the MATIC price hitting the upper band of this indicator suggests aggressive buying activity in a relatively short period. Thus, the indicator encourages a possible pullback before the price resume the bullish pattern.
MACD: The increasing gap between the MACD and a signal line in bullish alignment indicates improving market sentiments.
MATIC Coin Price Intraday Levels
- Spot rate: $0.84
- Trend: Bearish
- Volatility: Low
- Resistance levels- $0.87 and $0.95
- Support levels- $0.81 and $0.757
Play 10,000+ Casino Games at BC Game with Ease
- Instant Deposits And Withdrawals
- Crypto Casino And Sports Betting
- Exclusive Bonuses And Rewards


Why Trust CoinGape
CoinGape has covered the cryptocurrency industry since 2017, aiming to provide informative insights Read more…to our readers. Our journal analysts bring years of experience in market analysis and blockchain technology to ensure factual accuracy and balanced reporting. By following our Editorial Policy, our writers verify every source, fact-check each story, rely on reputable sources, and attribute quotes and media correctly. We also follow a rigorous Review Methodology when evaluating exchanges and tools. From emerging blockchain projects and coin launches to industry events and technical developments, we cover all facets of the digital asset space with unwavering commitment to timely, relevant information.


- Bitget Broadens Spot Market Access With Ondo Tokenized Stocks, ETFs and Precious Metals
- BestChange.com Triples Referral Rewards in Major Program Overhaul
- FUNToken Launches First Mobile Game “Bounce Helix” on Android
- Breaking: Citigroup Cuts Bitcoin and Ethereum Price Targets amid CLARITY Act Delays
- Breaking: Bitcoin Treasury Metaplanet Moves 4986 BTC, Stock Price Tanks 12%
- Will Dogecoin Price Break $0.15 Before March End 2026?
- Bitcoin Price Forecast: Will BTC Break $80k Ahead of Fed Decision Today?
- MSTR Stock Prediction as Strategy Makes Largest Bitcoin Purchase in 2026 and Analyst Targets BTC Price $100K
- Pi Network Price Prediction After Smart Contract and Second Migration Launch
- Pepe Coin Price Surges 20%- How High Can it Go in March?
- Is XRP Price Gearing Up For $2 Level As BTC Rebounds Above $74k?


