 Buy $GGs
Will This Pattern Crash XRP Or Is A Bullish Revival Set for 2023?


The XRP market has been exhibiting a head and shoulder pattern for the second half of 2022, which is often seen as a bearish signal indicating a potential decline in price. This pattern occurs when buyers are unable to push the price higher after reaching a certain level of support, known as the neckline, leading to a downward trend. However, a bullish indication hints at a bounce back in 2023.
Key points:
- A head and shoulder pattern govers the XRP price action
- A bullish breakout from $0.4 will undermine this bearish pattern
- The intraday trading volume in the XRP price is $372.1 million, indicating a 50% loss.
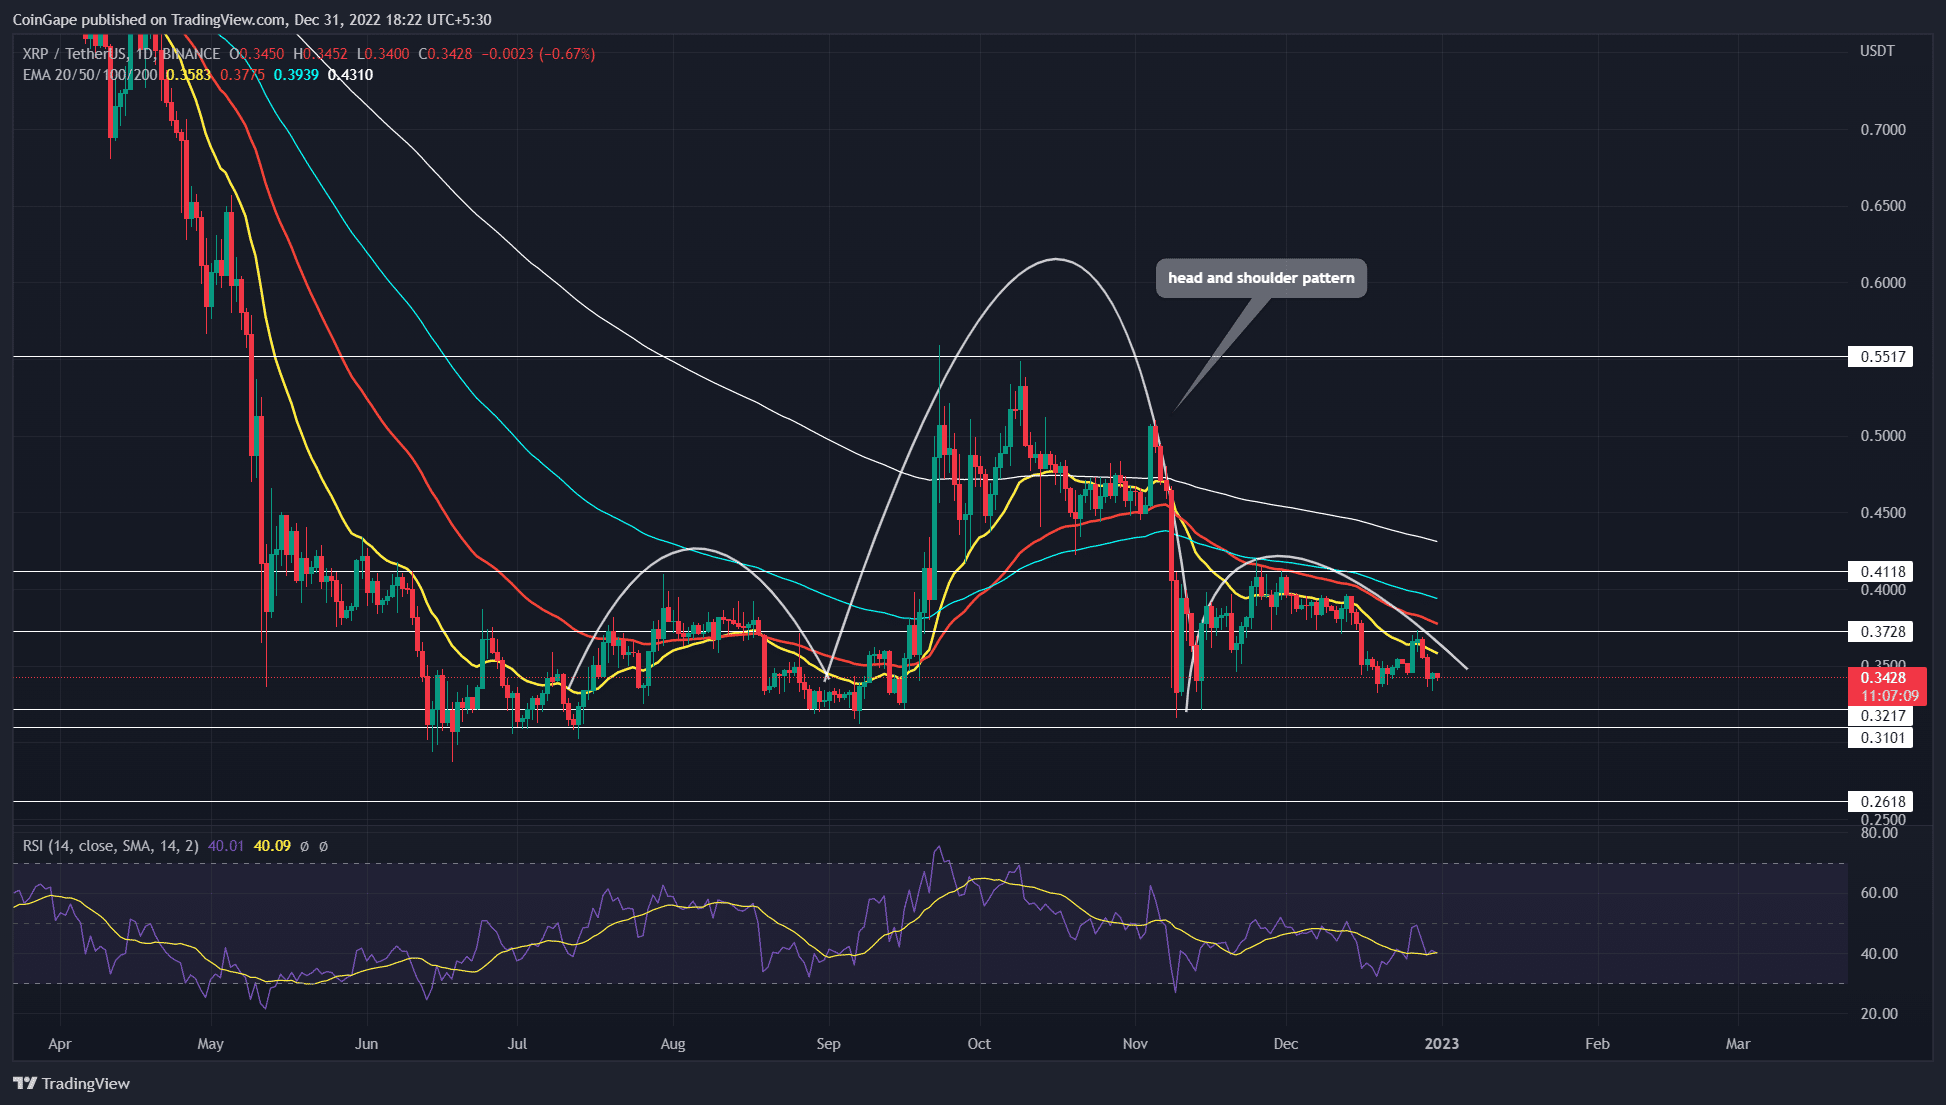 Source- Tradingview
Despite the recent bullish recovery reaching the heights of the 50-day EMA, the XRP market price takes a bearish turn to create a bearish pattern coming in the long term. In the month of December, the market value of the refill token has plunged by 16.5% and trades slightly below the mark of $0.35.
Coming back to the long term pattern, the price trend shows a head and shoulder pattern forming in the daily chart with the neckline at $0.31-0.3. The neckline gets credibility by acting as a strong support level during the consolidation phase between June and October.
Also read – XRP Lawsuit: XRP Holders Are Biggest Loser In Ripple Case? Attorney Suggests This
Continuing the falling trend under the bearish aligned EMAs, the market value may soon succumb below the neckline highlighting a bearish entry point.
In such a case, XRP investors can witness further decline in market price, potentially a drop of 37% to the next support level at $0.18.
On a contrary note, if the new year brings new investors for ripple, a reversal above the neckline crossing the $0.40 mark will break the bearish hypothesis.
Additionally, to support the bullish reversal a double bottom pattern is evident within the right shoulder of the bearish pattern.
Considering, the bulls get momentum in 2023, a double bottom breakout can revive the XRP buying spree.
Technical Indicator
EMA: undermining the recovery in November and December, the crucial daily EMAs- 20, 50, 100, 200 maintain a negative trend displaying a long term bearish phase in action.
Relative strength indicator: the RSI slope shows a short-term decline from the midline but the bullish divergence in the double bottom pattern keeps the hope burning for XRP buyers.
XRP intraday price levels
- Spot price: $0.344
- Trend: Bearish
- Volatility: High
- Resistance level- $0.373 and $0.41
- Support level- $0.31 and 0.26
Play 10,000+ Casino Games at BC Game with Ease
- Instant Deposits And Withdrawals
- Crypto Casino And Sports Betting
- Exclusive Bonuses And Rewards


Why Trust CoinGape
CoinGape has covered the cryptocurrency industry since 2017, aiming to provide informative insights Read more…to our readers. Our journal analysts bring years of experience in market analysis and blockchain technology to ensure factual accuracy and balanced reporting. By following our Editorial Policy, our writers verify every source, fact-check each story, rely on reputable sources, and attribute quotes and media correctly. We also follow a rigorous Review Methodology when evaluating exchanges and tools. From emerging blockchain projects and coin launches to industry events and technical developments, we cover all facets of the digital asset space with unwavering commitment to timely, relevant information.

Related Articles


- US-Iran War: Reports Confirm Bombings In UAE, Bahrain and Kuwait As Crypto Market Makes Recovery
- XRP Price Dips on US-Iran Conflict, But Capitulation Signals March Rebound
- Crypto Market at Risk as U.S.–Iran War Threatens Inflation With Oil Price Surge
- Polymarket U.S.–Iran Strike Bets Fuel Insider Trading Speculation as Crypto Traders Net $1.2M
- Cardano’s DeFi TVL Climbs as USDCx Stablecoin Launches on Network
- Analysts Predict Where XRP Price Could Close This Week – March 2026
- Top Analyst Predicts Pi Network Price Bottom, Flags Key Catalysts
- Will Ethereum Price Hold $1,900 Level After Five Weeks of $563M ETF Selling?
- Top 2 Price Predictions Ethereum and Solana Ahead of March 1 Clarity Act Stablecoin Deadline
- Pi Network Price Prediction Ahead of Protocol Upgrades Deadline on March 1
- XRP Price Outlook As Jane Street Lawsuit Sparks Shift in Morning Sell-Off Trend


