 Buy $GGs
XRP Price Analysis: Bullish Pattern Sets $XRP Price to Surpass $0.55; Buy Now?


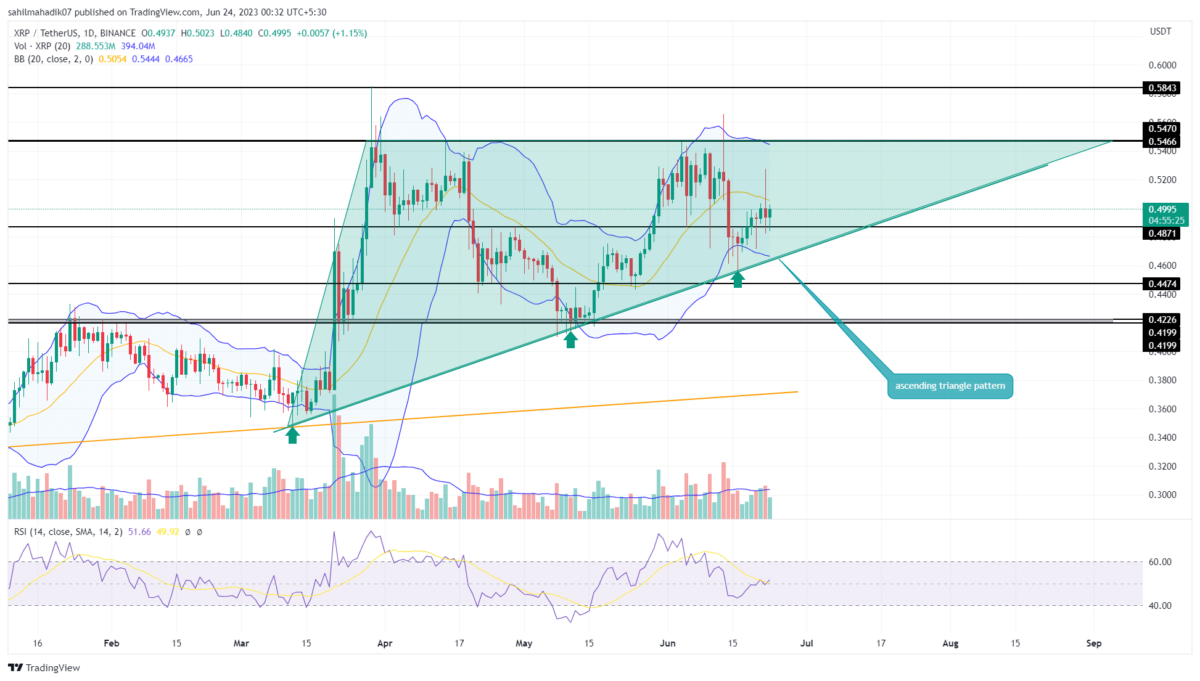
XRP Price Analysis: On June 19th, the ongoing bullish recovery in XRP price gave an upswing breakout from $0.487 resistance. This breakout should offer buyers another setup stone to prolong the bullish recovery and reclaim the lost ground. Currently, the altcoin is trading at $0.49 and trying to sustain above the breached resistance. Can this recovery surpass the multi-month resistance of $0.55?
Also Read: XRP Was Marked For Death, Says Bitcoin Maxi; XRP Lawyer, Ripple CTO Replies
XRP Price Daily Chart:
- In theory, the higher lows formed during the development of the triangle pattern reflect the gradual growth in bullish momentum
- The XRP price may face high selling pressure at $0.55
- The intraday trading volume in the XRP is $1.04 Billion, indicating a 33% loss.
 Source- Tradingview
Over the past few days, the XRP price has been wavering above the recently reclaimed $0167 resistance. During this consolidation, the daily candles showed some long tail rejections indicating the buyers are actively defending the new flipped support.
If the bullish momentum persists, the XRP price is likely to surge 9.6% and rechallenge the $0.55 resistance. Thus, the aforementioned multi-month resistance is also the neckline resistance of the triangle pattern, and therefore it stands as a high supply zone against buyers.
Until the overhead resistance and rising trendline are intact, the XRP price would continue with its sideways trend.
Is This the Right Time to Buy XRP?
In the daily time frame chart, the XRP price shows the formation of an ascending triangle pattern. This pattern gradually increased the underlying bullish momentum and set the asset for a breakout above neckline resistance. Thus, potential investors waiting for any entry opportunity could enter at the rising trendline or for more convicting wait for $0.55 breakout.
- Relative Strength Index: The daily RSI slope at 50% reflects a neutral sentiment in the market.
- Bollinger Band: The flattish bands of Bollinger band indicator project a volatile market and the likelihood of a prolonged sideways trend.
Play 10,000+ Casino Games at BC Game with Ease
- Instant Deposits And Withdrawals
- Crypto Casino And Sports Betting
- Exclusive Bonuses And Rewards


Why Trust CoinGape
CoinGape has covered the cryptocurrency industry since 2017, aiming to provide informative insights Read more…to our readers. Our journal analysts bring years of experience in market analysis and blockchain technology to ensure factual accuracy and balanced reporting. By following our Editorial Policy, our writers verify every source, fact-check each story, rely on reputable sources, and attribute quotes and media correctly. We also follow a rigorous Review Methodology when evaluating exchanges and tools. From emerging blockchain projects and coin launches to industry events and technical developments, we cover all facets of the digital asset space with unwavering commitment to timely, relevant information.

Related Articles


- Crypto Market Bill Hits New Deadlock as Banks Reject White House Deal
- Why Experts Are Warning Bitcoin Rally Could Be A “Dead Cat Bounce”
- BTC and Gold Price Bounce as Trump Admin Brokers US-Venezuela 1000 Kg Gold Deal
- SEC Advances Major Crypto Securities Plan to White House for Approval
- Peter Brandt Flips Bullish, Predicts Bitcoin Rally As Price Holds Above $70k
- XRP Price As Bitcoin Reclaims $74K- Is $5 Next?
- Dogecoin Price Outlook as BTC Recovers Above $73,000
- XRP Price Prediction as Iran-U.S. Peace Talks Trigger a Crypto Rally
- COIN Stock Analysis as Bitcoin Retests $72k Ahead of February NFP Data
- Robinhood Stock Price Prediction As Cathie Wood Buys $12M Dip in Bold ARK Move
- Bitcoin Price At Risk? Professor Who Predicted US-Iran War Says America Could Lose


