 Buy $GGs
XRP Price Analysis: Can $0.5 Support Mark a Turning Point in Correction?


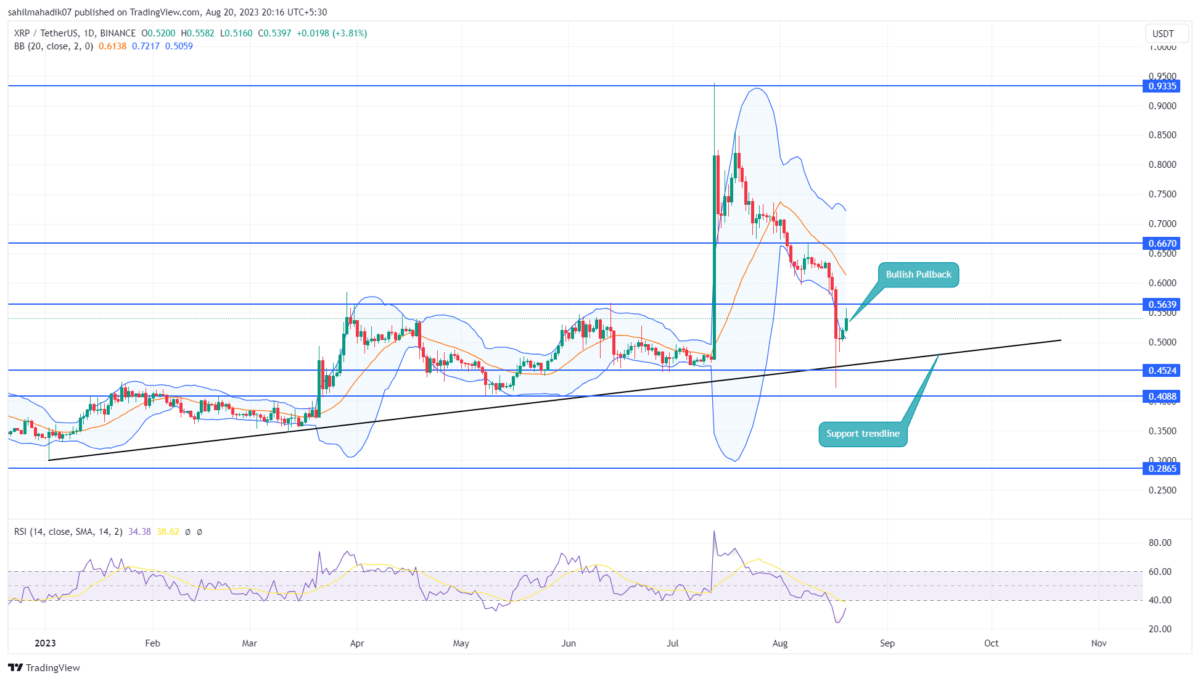
The XRP price has been in a correction phase for over a month now, where it plunged from the top of $0.938 to $0.4226 low accounting for a 54.5% loss. However, this falling price found suitable support at the long-coming support trendline aligned with the $0.5 psychological level, offering buyers a platform to counterattack. Can these support bolster buyers for a fresh recovery rally?
Also Read: Ripple Now In Bank for International Settlements (BIS) Panel; XRP Rally Ahead?
XRP Daily Chart: Key Points
- An ascending trendline keeps the long-term trend bullish for XRP holders
- An upside breakout from the $0.5948 mark may bolster a bullish recovery
- The intraday trading volume in the XRP is $1.6 Billion, indicating a 42% gain.
 Source: Tradingview`
Although the significant sell-off on August 17th breached the $0.564 support, the daily chart indicated that by the close of the day, more than half of the intraday loss had been regained. A long-wick rejection attached to the daily candle reflects the accumulation of buyers at a discounted price.
This rejection sign came at the combined support ascending support trendline aligned and $0.5 psychological level, offering buyers a suitable footing to turn the price higher. With an intraday of 4.67%, the XRP price currently trades at $0.54 and is likely to retest the $0.564 resistance.
For the XRP coin to undermine the prior breakdown, the buyers need to break above the August 17th high of $0.5948. This breakdown will break the seller’s weapon and bolster buyers for recovery to $0.667, followed by $0.854, and $0.933.
[converter id=”xrp-xrp” url=”https://coingape.com/price/converter/xrp-to-usd/?amount=1″]
Will XRP Correction Fall Below $0.5?
The XRP holders must closely watch the price retest to the recently reclaimed resistance of $0.564. This retest could determine the possibility of further downfall or trend reversal. If the altcoin price shows suitability below the aforementioned level, the sellers may reattempt to break below $0.5 or ascending support trendline.
- Bollinger Band: A downtick in the lower band of the Bollinger band indicator shows the bearish momentum in active.
- Relative Strength Index: The RSI slope potential break above the 40% mark would offer additional confirmation on a bullish reversal.
Play 10,000+ Casino Games at BC Game with Ease
- Instant Deposits And Withdrawals
- Crypto Casino And Sports Betting
- Exclusive Bonuses And Rewards


Why Trust CoinGape
CoinGape has covered the cryptocurrency industry since 2017, aiming to provide informative insights Read more…to our readers. Our journal analysts bring years of experience in market analysis and blockchain technology to ensure factual accuracy and balanced reporting. By following our Editorial Policy, our writers verify every source, fact-check each story, rely on reputable sources, and attribute quotes and media correctly. We also follow a rigorous Review Methodology when evaluating exchanges and tools. From emerging blockchain projects and coin launches to industry events and technical developments, we cover all facets of the digital asset space with unwavering commitment to timely, relevant information.

Related Articles


- Goldman Sachs CEO Predicts ‘Weeks’ of Crypto Market Crash as U.S Iran War Continues
- Polymarket Axes ‘Nuclear Detonation’ Prediction Market Amid Public Fury
- Indiana Signs Bitcoin Bill Into Law Allowing Crypto in Retirement Plans
- ‘Time to Act Is Now’: CFTC Chief Pushes Swift Passage of CLARITY Act
- Trump Tells Congress to Pass Crypto Market Bill ‘ASAP,’ Blasts Banks for Stalling
- Gold Price Prediction March 2026: Rally, Crash, or Record Highs?
- RIOT Stock Prediction as Needham, Piper Sandler Slash Target After Earnings
- Cardano Price Outlook As Charles Hoskinson Warns Over CLARITY Act
- Circle Stock Price Climbs 15% to $96, Can Rally Continue in March 2026?
- Bitcoin Price Prediction as US-Iran War Enters 4th Consecutive Day
- Top 5 Historical Reasons Dogecoin Price Is Not Rising


