XRP Price Analysis: Can 200-day EMA Breakdown Push Prices Below $0.5?


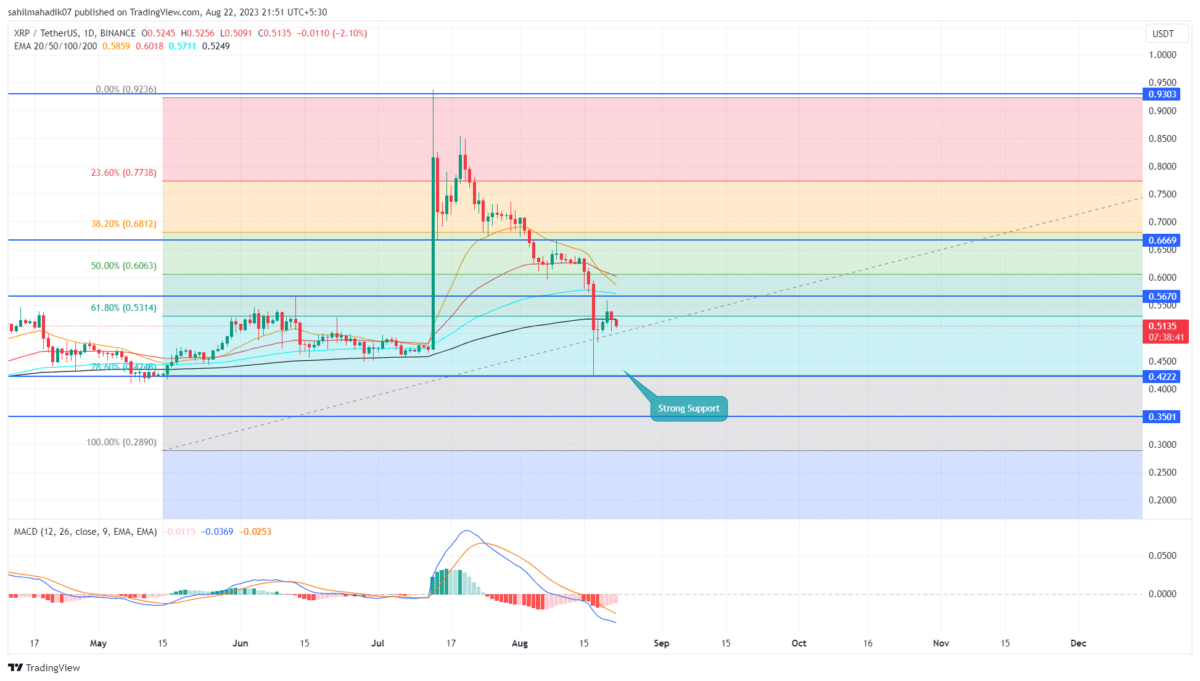
Amid the increasing bearishness in the crypto market, the XRP price witnessed a massive sell-off on August 17th, leading the correction trend to a low of $0.4226. Considering the high of $0.938, this downfall registered around a 54.5% loss in the last six weeks. Can the aforementioned support aligned with the 78.6% Fibonacci retracement level recuperate the bullish momentum?
Also Read: XRP Facing Bear vs Bull Showdown; Who Will Win
XRP Daily Chart: Key Points
- The XRP price can witness increasing demand pressure at $0.422
- The coin price below 200-day EMA projects a downtrend sentiment
- The intraday trading volume in the XRP is $1.08 Billion, indicating a 23% loss.
 Source: Tradingview`
A keen look at the daily time frame chart shows the August 17th candle projects a long-tail rejection at the combined support at $0.422 and 78.6% FIB. This lower price rejection indicates accumulation at lower levels, leading to a minor pullback of 10%.
However, the price trend reverted immediately from a high of $0.5582, indicating the sellers continue to sell on a bullish bounce which is a common trait of an established downtrend. By the press time, the XRP price trades at $0.514 with an intraday loss of 2%.
With sustained selling, the coin price should drop another 17% to break the $0.422 support. This breakdown should continue the correction trend and push the prices to $0.35.
Will XRP Price Recovery Back to $0.668?
While the price action hints the XRP price may continue to lose more ground, the rising demand pressure at $0.422 can offer buyers an opportunity to counterattack. A potential upswing would get better confirmation of a bullish recovery if the buyers break above the August 17th high of $0.5948 high. The post-breakout rally would lead the price back to the $0.668 mark.
- Exponential Moving Average: A bearish crossover between the 20-and-100-day EMA may accelerate the selling pressure among traders.
- Moving Average Convergence Divergence: A significant gap between the MACD(blue) and signal(orange) in a bearish alignment reflects the downtrend sentiment.

Why Trust CoinGape
CoinGape has covered the cryptocurrency industry since 2017, aiming to provide informative insights Read more…to our readers. Our journal analysts bring years of experience in market analysis and blockchain technology to ensure factual accuracy and balanced reporting. By following our Editorial Policy, our writers verify every source, fact-check each story, rely on reputable sources, and attribute quotes and media correctly. We also follow a rigorous Review Methodology when evaluating exchanges and tools. From emerging blockchain projects and coin launches to industry events and technical developments, we cover all facets of the digital asset space with unwavering commitment to timely, relevant information.

Related Articles


- XRP Sees Largest Realized Loss Since 2022, History Points to Bullish Price Run: Report
- US Strike on Iran Possible Within Hours: Crypto Market on High Alert
- MetaSpace Will Take Its Top Web3 Gamers to Free Dubai Trip
- XRP Seller Susquehanna Confirms Long-Term Commitment to Bitcoin ETF and GBTC
- Vitalik Buterin Offloads $3.67M in ETH Amid Ethereum Price Decline
- Top 4 Reasons Why Bitcoin Price Will Crash to $60k This Week
- COIN Stock Price Prediction: Will Coinbase Crash or Rally in Feb 2026?
- Shiba Inu Price Feb 2026: Will SHIB Rise Soon?
- Pi Network Price Prediction: How High Can Pi Coin Go?
- Dogecoin Price Prediction Feb 2026: Will DOGE Break $0.20 This month?
- XRP Price Prediction As SBI Introduces Tokenized Bonds With Crypto Rewards


