
XRP Price Analysis: Can $XRP Hold $0.486 Support As Market FUD Rises?


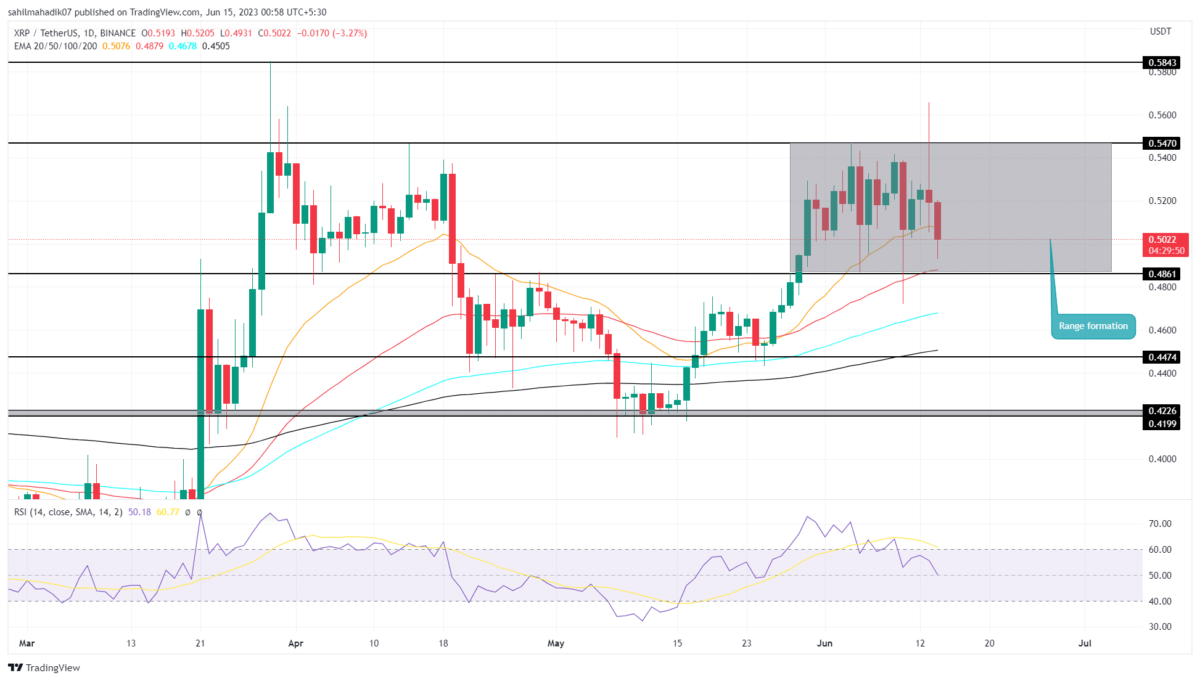
XRP Price Analysis: The ongoing recovery trend in the XRP price hit a major roadblock at $0.55 resistance. This high supply zone aligned with bearish market sentiment prevented buyers from making further recovery and turned the coin price into a sideways trend. As a result, the XRP price is currently resonating between $0.54 and $0.486 levels creating a narrow range formation.
Also Read: Can XRP Price Really Hit $50? This Crypto Analyst Thinks Yes
XRP Price Daily Chart:
- Range formation indicates the coin price is wobbling in a no-trading zone
- The XRP price can maintain its recovery trendline until the $0.486 support is intact
- The intraday trading volume in the XRP is $1.28 Billion, indicating a 10% gain.
 Source- Tradingview
In the daily time frame chart, the XRP price shows a range formation between $0.55 and $0.486 level. Over the past two weeks, the coin price has rebounded from the aforementioned levels twice indicating the traders are respective to this chart levels.
At the time of writing, the XRP price traded at $0.50, and with a 2.87% loss, it has recently reverted from the above resistance. If the bullish momentum rises, the coin price may fall another 3.4% to retest the bottom support.
For interested traders, this range breakout is important to determine the future trend.
While the current trend in the XRP price is bullish, a potential breakout above $0.55 with a daily candle closing will intensify the bullish momentum and may surge the price above $0.6
Will XRP Price go Back to $0.4475?
If the ongoing range formation results in a bearish note with the breakdown of $0.486 support, the underlying selling pressure in the XRP price will rise significantly. The breakdown will offer sellers additional resistance to pressurize prices to lower levels. As a result, the coin holders could witness a swift fall to $0.4475, registering an 8% loss.
Play 10,000+ Casino Games at BC Game with Ease
- Instant Deposits And Withdrawals
- Crypto Casino And Sports Betting
- Exclusive Bonuses And Rewards


Why Trust CoinGape
CoinGape has covered the cryptocurrency industry since 2017, aiming to provide informative insights Read more…to our readers. Our journal analysts bring years of experience in market analysis and blockchain technology to ensure factual accuracy and balanced reporting. By following our Editorial Policy, our writers verify every source, fact-check each story, rely on reputable sources, and attribute quotes and media correctly. We also follow a rigorous Review Methodology when evaluating exchanges and tools. From emerging blockchain projects and coin launches to industry events and technical developments, we cover all facets of the digital asset space with unwavering commitment to timely, relevant information.

Related Articles


- Breaking: U.S. CPI Holds Steady at 2.4% as Iran War Raises Inflation Concerns
- Bitget Launches GetClaw Agent as Exchange Integrates AI Tools For Crypto Trading
- Breaking: Binance Sues WSJ For Defamation Over Iran Sanctions Article as DOJ Opens Probe
- Forbes Billionaires 2026: Elon Musk Reclaims Forbes Richest Spot; Crypto Leaders CZ and Ardoino Follow
- Will Bitcoin Retreat? Wall Street, Kalshi’s US CPI Inflation Estimate as Oil Prices Rebound
- XRP Price Prediction as Goldman Sachs Becomes Biggest Holder of Ripple ETFs
- Circle (CRCL) Stock Price Prediction Ahead of CPI Data Release-Is 120 Next?
- Bitcoin Price Today: President Trump Signals Iran Conflict May End Soon As BTC Eyes $72k
- Top Analyst Explains Why Pi Network Price May Soar to $0.50 This Week
- Is MSTR Stock Going to Rally $150?
- Bitcoin And XRP Price Prediction As US Oil Prices Fall Sharply- Will This Spark a New Bull Rally?


