XRP Price Analysis: Bullish Pattern Sets $XRP Price Rally to $0.55; Enter Now?


XRP Price Analysis: On 16th June, the XRP price rebounded from a support trendline which has been carrying a sustained recovery for the past 100 days. The reversal initiated a fresh recovery which has surged the prices 7.66% higher to currently trade at $0.492. Amid this rally, the coin price has breached the immediate resistance of $0.487, providing an additional stepping stone to rise higher.
Also Read: XRP Price Stuck Under $0.5: Is It Time to Accumulate XRP Despite Price Doldrums?
XRP Price Daily Chart:
- The new higher low formation at the $0.4558 mark reflects buyers’ continues to accumulate at price dips
- A bullish breakout from the $0.487 resistance offer buyers an entry opportunity with a potential upswing of 11%
- The intraday trading volume in the XRP is $1.2 Billion, indicating a 34% gain.
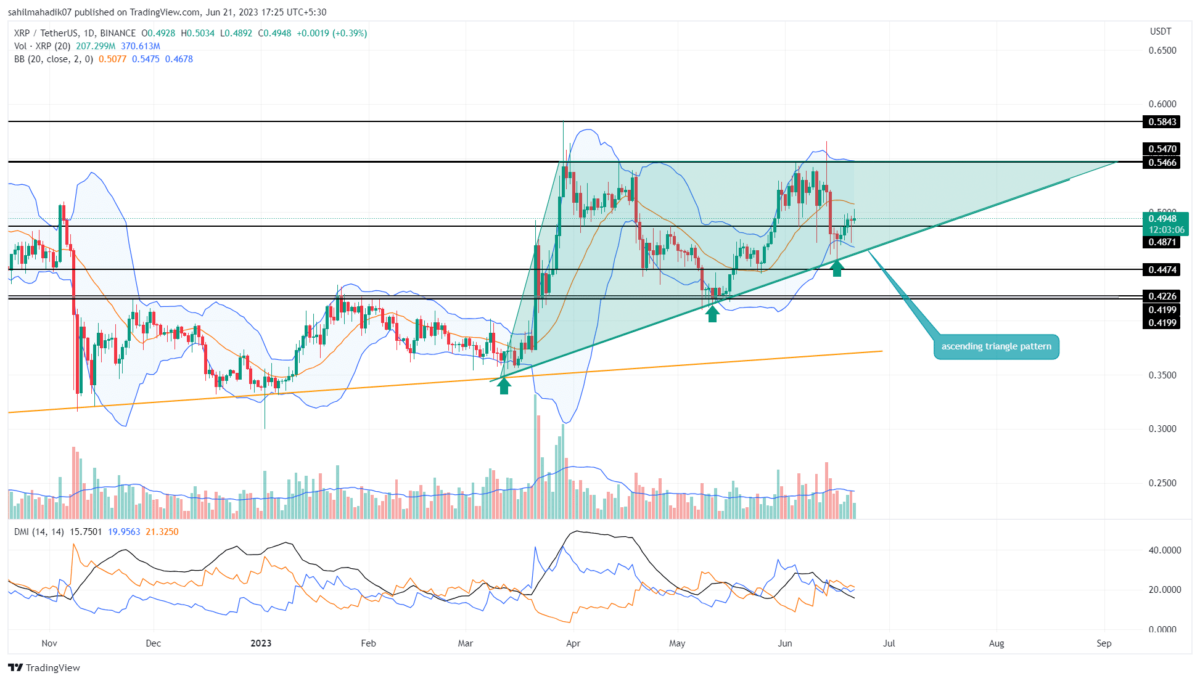
 Source- Tradingview
Concerning the long-coming support trendline and $0.55 horizontal level, the XRP price shows the formation of an ascending triangle pattern in the daily chart. Under the influence of this pattern, the asset price developing new higher lows indicates gradual growth in underlying bullish momentum.
Amid the recent growth in the crypto market, the XRP price has rebounded from the support trendline and set a new bull cycle within the pattern. As of now, the prices are wavering above the recently reclaimed $0.487 horizontal trying to obtain suitable support.
If the buyers could sustain this level, the altcoin’s market value would rise 11% to hit the $0.55 barrier.
Is XRP Price Ready to Surpass $0.55?
Under the development of an ascending triangle pattern, the XRP price is poised to hit the $0.55 barrier. However, a breakout above this barrier is less likely in the near term as buyers need more aggression to overcome this multi-month ceiling. Anyhow, as more trading days pass by, the coin price is likely to resonate and coil narrow within the triangle which may eventually break the $0.55 resistance.
- Average Directional Index: The ADX slope shows no upswing to the recent price surge indicating the buyers currently lack the strength to trigger an aggressive rally.
- Bollinger Band: The upper band of the Bollinger band indicator wavering flat near the $0.55 level increases the resistance strength of this barrier.

Why Trust CoinGape
CoinGape has covered the cryptocurrency industry since 2017, aiming to provide informative insights Read more…to our readers. Our journal analysts bring years of experience in market analysis and blockchain technology to ensure factual accuracy and balanced reporting. By following our Editorial Policy, our writers verify every source, fact-check each story, rely on reputable sources, and attribute quotes and media correctly. We also follow a rigorous Review Methodology when evaluating exchanges and tools. From emerging blockchain projects and coin launches to industry events and technical developments, we cover all facets of the digital asset space with unwavering commitment to timely, relevant information.

Related Articles


- Top 3 Reasons Why Crypto Market is Down Today (Feb. 22)
- Michael Saylor Hints at Another Strategy BTC Buy as Bitcoin Drops Below $68K
- Expert Says Bitcoin Now in ‘Stage 4’ Bear Market Phase, Warns BTC May Hit 35K to 45K Zone
- Bitcoin Price Today As Bulls Defend $65K–$66K Zone Amid Geopolitics and Tariffs Tensions
- XRP Realized Losses Spike to Highest Level Since 2022, Will Price Rally Again?
- COIN Stock Price Prediction: Will Coinbase Crash or Rally in Feb 2026?
- Shiba Inu Price Feb 2026: Will SHIB Rise Soon?
- Pi Network Price Prediction: How High Can Pi Coin Go?
- Dogecoin Price Prediction Feb 2026: Will DOGE Break $0.20 This month?
- XRP Price Prediction As SBI Introduces Tokenized Bonds With Crypto Rewards
- Ethereum Price Rises After SCOTUS Ruling: Here’s Why a Drop to $1,500 is Possible


