 Buy $GGs
XRP Price Analysis: $XRP Price Coiling Before a Massive Move; Buy or Sell?


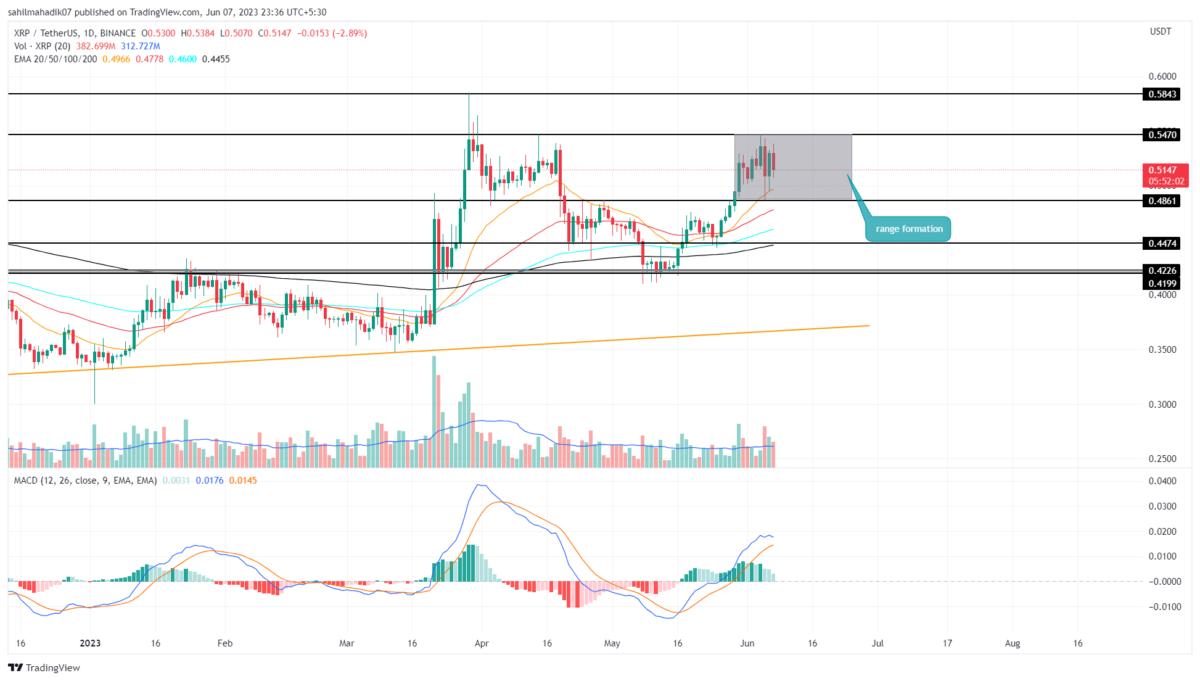
XRP Price Analysis: The V-shaped recovery in XRP price takes a major halt at $0.55 resistance and the broader market suffers from uncertainty. The coin price waver below the aforementioned resistance with no clear sign of dominance from the buyers or sellers. This sideways is likely to continue and may create a range in the daily time chart. Here’s how interested market participants may use the potential price pattern to grab entry opportunities.
Also Read: Pro XRP Lawyer Drops New Evidence Supporting XRP Isn’t A Security
XRP Price Daily Chart:
- A breakout above $0.55 will project an early sign of trend reversal.
- A bearish breakdown below $0.486 may lead to a slight correction in the XRP price.
- The intraday trading volume in the XRP is $1.73 Billion, indicating a 5% gain.
 Source- Tradingview
Despite the recent sell-off in the crypto market, the June 5th daily candle of the XRP price didn’t breach the local support of $0.486. The potential reversal from this level accentuated the buyers are defending the newly reclaimed level and the coin is likely to fail below if the recovery sentiment is intact.
On the flip side, the $0.55 is the multi-month resistance that has offset the coin buyers’ attempt to carry a sustained recovery for over a year. Thus, the coin holders can mark the above-mentioned level as the extreme barrier of the range.
In case of a breakdown below $0.486, the traders may witness another correction phase and plunge the price to $0.426.
On a contrary note, a decisive breakout above $0.55 with a daily candle closing is needed to confirm the possibility of price recovery.
Will XRP Price Plunge to $0.45?
The XRP price is likely to continue its sideways trend until it breached either level of the daily range. If the market sentiment shows negative traits in the coming days, a breakdown below $0.486 will signal the upcoming free fall in XRP price. This breakdown could tumble the price 13% down to hit $0.426, within between support of $0.447.
- Moving Average Convergence Divergence: A potential bearish crossover between the MACD(blue) and the signal(orange) line will increase the negative sentiment in the XRP price.
- Exponential Moving Average: The 50-day EMA slope wavering near the $0.486 level strengthened the support power of this level.
Play 10,000+ Casino Games at BC Game with Ease
- Instant Deposits And Withdrawals
- Crypto Casino And Sports Betting
- Exclusive Bonuses And Rewards


Why Trust CoinGape
CoinGape has covered the cryptocurrency industry since 2017, aiming to provide informative insights Read more…to our readers. Our journal analysts bring years of experience in market analysis and blockchain technology to ensure factual accuracy and balanced reporting. By following our Editorial Policy, our writers verify every source, fact-check each story, rely on reputable sources, and attribute quotes and media correctly. We also follow a rigorous Review Methodology when evaluating exchanges and tools. From emerging blockchain projects and coin launches to industry events and technical developments, we cover all facets of the digital asset space with unwavering commitment to timely, relevant information.

Related Articles


- Breaking: Oil Prices Climb as Iran Set To Deploy Mines in Strait of Hormuz
- Why Is Crypto Market Up Today? 5 Key Reasons Behind the Rally
- Top U.S. Banks Weigh Lawsuit Against OCC Over Crypto Firm Charters
- CLARITY Act: Key Democrat Says Banks May Have to Compromise as Senate Eyes Crypto Bill’s Markup
- XRP News: Brad Garlinghouse Predicts ‘Defining Year’ For Ripple With XRP At The Center
- XRP Price Prediction as Goldman Sachs Becomes Biggest Holder of Ripple ETFs
- Circle (CRCL) Stock Price Prediction Ahead of CPI Data Release-Is 120 Next?
- Bitcoin Price Today: President Trump Signals Iran Conflict May End Soon As BTC Eyes $72k
- Top Analyst Explains Why Pi Network Price May Soar to $0.50 This Week
- Is MSTR Stock Going to Rally $150?
- Bitcoin And XRP Price Prediction As US Oil Prices Fall Sharply- Will This Spark a New Bull Rally?


