
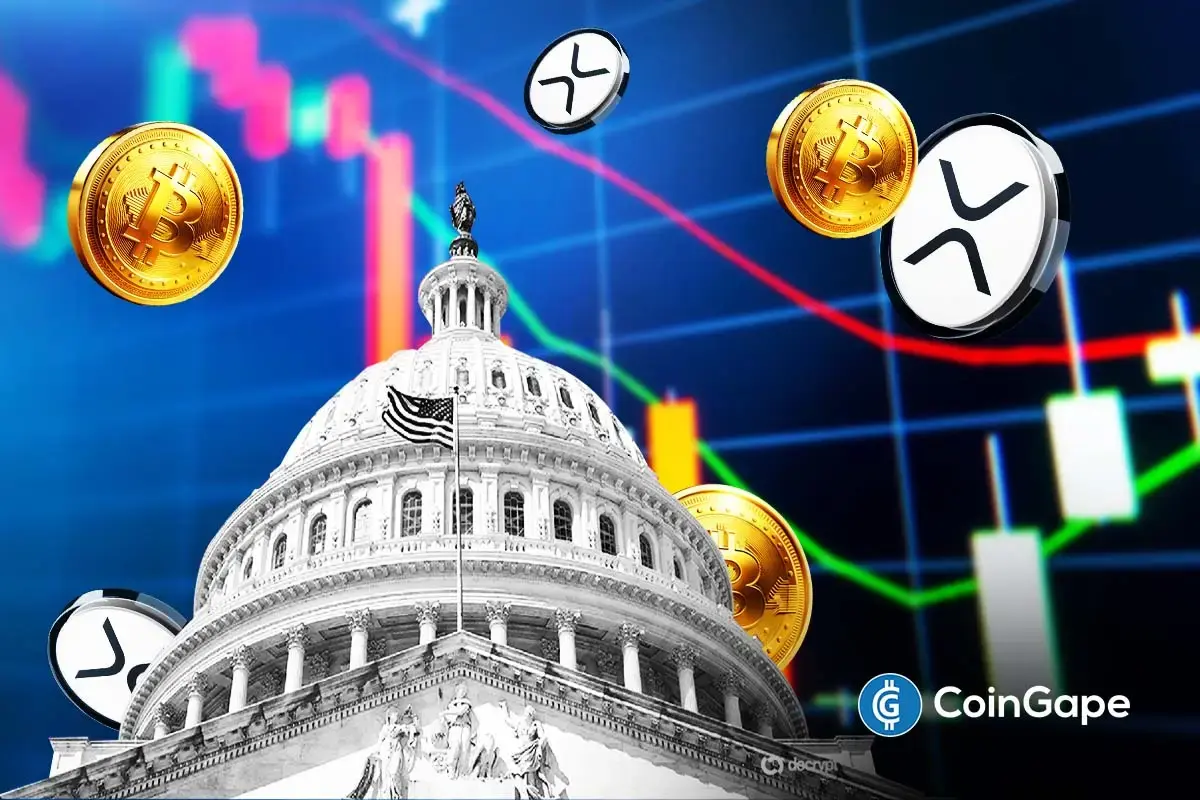
XRP Price Escaped Out Of Uncertainty Eyes For 10-15% Upswing In Near term


The recent bullish reversal from the $0.33 support revealed the formation of a double bottom pattern in the daily time frame chart. Over the past six days, the XRP price has soared 10.1% and is currently trading at the $0.365 mark. Under the influence of this bullish pattern, the coin price is likely to break the $0.374 resistance, bolstering further growth potential for XRP.
Key points:
- The XRP price potential breakout from $0.374 will prolong the recovery rally to $0.42
- The recent price jump reclaimed the 20-day EMA, providing the coin holders additional support.
- The intraday trading volume in the XRP is $1.16 Billion, indicating a 14.2% gain.
 Source- Tradingview
While a majority of major altcoins were rising higher with the new year recovery in the crypto market, the XRP price was struggling to break the local resistance of $0.356. Over the past ten days, this altcoin was wobbling between $0.356 and $0.35, creating a narrow range.
Moreover, the daily candles resonating between the aforementioned range showed several long-wick rejections on either side, accentuating the ongoing uncertainty in the crypto market. However, today, the XRP coin witnessed a significant inflow and rose 4% on the intraday level.
The long bullish candle with sufficient volume breaks the $0.359 resistance, releasing this altcoin from stagnant market sentiment. If the daily candle closes above the breached resistance, the buyers get a higher footing to continue to rally in the price chart.
Also read: CRYPTO TELEGRAM CHANNELS LIST 2023
Thus, with sustained buying, the XRP price may break the $0.374 neckline resistance of the double bottom pattern. In theory, this pattern in this technical setup is one of the most frequently observed patterns which encourages directional bull run.
Thus, a bullish breakout from $ 0.374 will intensify the buying pressure in the market and prolong the bullish growth to $0.396 or $0.42, registering a 10-15% hike.
Alternatively, a less likely yet possible reversal from the $0.374 barrier will undermine the bullish thesis.
Technical Indicator
EMAs: the downsloping 50-day EMA is currently working in the seller’s favor trying to stall rising prices.
Relative Strength Index: conversely to the sideways XRP price, the daily RSI slope is sharply rising, reflecting the growth in bullish momentum. Thus, this bullish divergence increases the possibility of a $0.374 breakout.
XRP intraday price levels
- Spot price: $0.39
- Trend: Bullish
- Volatility: Low
- Resistance level- $0.374 and $0.396
- Support level- $0.355 and 0.
Play 10,000+ Casino Games at BC Game with Ease
- Instant Deposits And Withdrawals
- Crypto Casino And Sports Betting
- Exclusive Bonuses And Rewards


Why Trust CoinGape
CoinGape has covered the cryptocurrency industry since 2017, aiming to provide informative insights Read more…to our readers. Our journal analysts bring years of experience in market analysis and blockchain technology to ensure factual accuracy and balanced reporting. By following our Editorial Policy, our writers verify every source, fact-check each story, rely on reputable sources, and attribute quotes and media correctly. We also follow a rigorous Review Methodology when evaluating exchanges and tools. From emerging blockchain projects and coin launches to industry events and technical developments, we cover all facets of the digital asset space with unwavering commitment to timely, relevant information.


- Will CLARITY Act Pass in 2026? Galaxy’s Alex Thorn Warns April Deadline Is Critical
- MetaMask Token Launch: MASK Airdrop Now Live for Eligible Wallets
- L2 Unity Launches 50M Token Airdrop Across Arbitrum and Optimism, Eligibility Open for 100K Wallets
- Tom Lee’s Bitmine Adds 5,000 ETH Despite $7.5B Unrealized Loss as BMNR Stock Rebounds
- CLARITY Act Should Ban Stablecoin Yields to Advance in Senate, French Hill Says
- Bitcoin and XRP Price Outlook If the Senate Banking Committee Approves the CLARITY Act
- Official Trump Price Prediction As TRUMP Token Soars 50% Ahead Mar-a-Lago Invite Buzz for Top Holders
- Solana vs XRP Price Forecast: Can SOL Reclaim Its All-Time High Before XRP Hits $2?
- Top Analyst Predicts Cardano Price Could Surge 100% As Bitcoin Breaks $72k
- What’s Keeping Shiba Inu Below $0.0000065- Analyst Predicts 30% Rise Ahead
- Will BTC Price Rally to $100K by 2026? Kalshi and Polymarket Odds Climb to 51%


