 Buy $GGs
XRP Price Prediction As $0.5 Breakdown Hint Further Correction Ahead


Amidst the current uncertainty around the Spot Bitcoin ETF, the crypto market witnessed high volatility this week. On October 16, a majority of major cryptocurrencies witnessed significant buying pressure, but many failed to sustain these gains and followed an immediate reversal. Thus, the 5th largest cryptocurrency XRP tried to regain $0.5 psychologically but experienced a notable supply pressure from above.
Also Read: New Whale Buys 410 Million XRP Worth Over $200 Mln, What’s Happening?
Is XRP Price Heading to $0.458?
- The XRP price witnessed supply pressure at the $0.5 mark
- A breakdown below the triangle pattern hints the sellers may extend the correction trend
- The intraday trading volume in the XRP is $619 Million, indicating a 13% loss
 Source: Tradingview
The XRP price has been under significant bearish pressure in October, dropping from a high of $0.548 to its current level of $0.489. This 11.2% decline broke through the support trendline of what was initially an ascending triangle pattern, a typically bullish pattern.
The breakdown from this formation indicates strong bearish momentum, and the failure to reclaim the psychological $0.50 level on October 16 further emphasizes the selling pressure. The altcoin’s brief surge to test the new resistance level, formed after the breakdown of the ascending triangle, met with a long-wick rejection on the daily chart.
This behavior suggests that the bears are currently in control and that the downward trend could continue. Should the sellers break below the low of the retest candle at $0.485, we could potentially see XRP decline a further 6.5% to reach the combined support level at $0.458 and a longer-term trendline.
[converter id=”xrp-xrp” url=”https://coingape.com/price/converter/xrp-to-usd/?amount=1″]
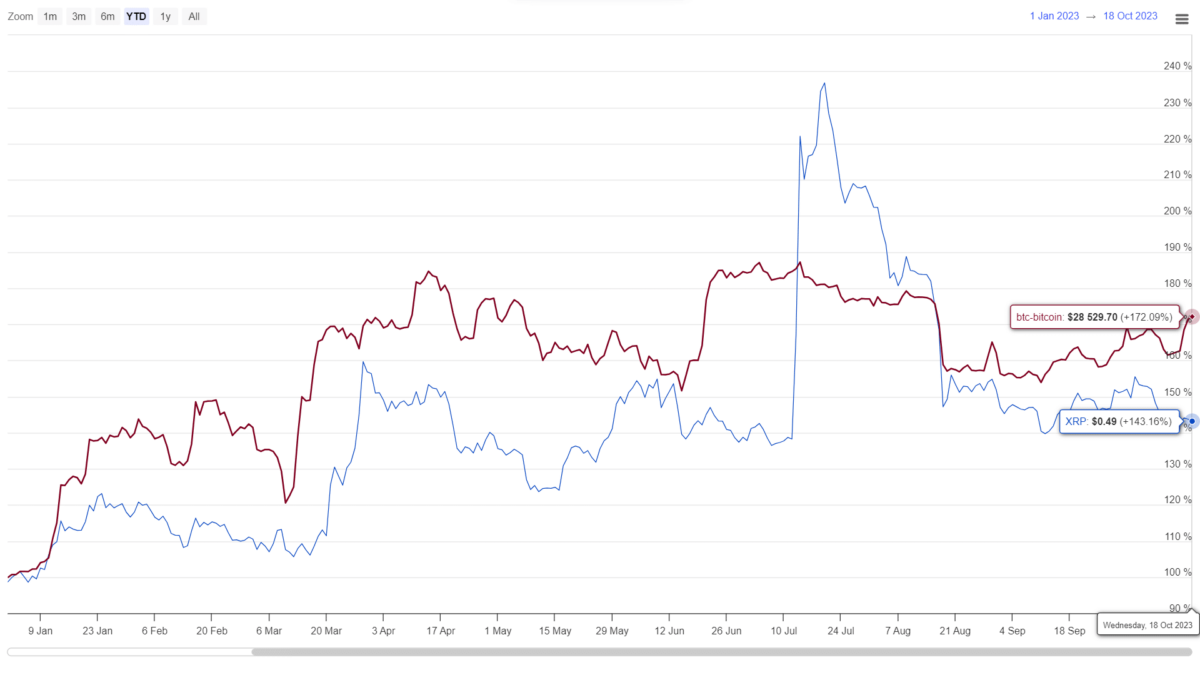
XRP vs BTC Performance
 Source: Coingape| XRP Vs Bitcoin Price
In a broader comparative analysis, both Bitcoin and XRP have generally been on an uptrend since the start of 2023. During the period, the Bitcoin price showcased a stable rally. However, the higher volatility in XRP price and its proximity to its last swing low of $0.45 suggests a weakening in buyer conviction.
- Bollinger Bands: A downtick in the lower band of the Bollinger Band indicator reflects the bearish momentum is still aggressive.
- Moving Average Convergence Divergence. A bearish crossover state between the MACD blue and signal orange band reflects an active downward trend.
Play 10,000+ Casino Games at BC Game with Ease
- Instant Deposits And Withdrawals
- Crypto Casino And Sports Betting
- Exclusive Bonuses And Rewards


Why Trust CoinGape
CoinGape has covered the cryptocurrency industry since 2017, aiming to provide informative insights Read more…to our readers. Our journal analysts bring years of experience in market analysis and blockchain technology to ensure factual accuracy and balanced reporting. By following our Editorial Policy, our writers verify every source, fact-check each story, rely on reputable sources, and attribute quotes and media correctly. We also follow a rigorous Review Methodology when evaluating exchanges and tools. From emerging blockchain projects and coin launches to industry events and technical developments, we cover all facets of the digital asset space with unwavering commitment to timely, relevant information.

Related Articles


- BTC Price Bounces as Spot Investors Buy The Dip Amid Iran War Jitters
- CFTC Chief Mike Selig Signals US Crypto Perpetual Futures Rollout in Coming Weeks
- Fed Rate Cut Odds Drop as Inflation Fears Rise Due To U.S. Iran Conflict
- Here’s Why Tether Gold (XAUt) Price Is Falling Even With Growing Gold Demand
- XRP News: Ripple Expands Payments Platform To Unify Fiat and Stablecoins Globally
- Gold Price Prediction March 2026: Rally, Crash, or Record Highs?
- RIOT Stock Prediction as Needham, Piper Sandler Slash Target After Earnings
- Cardano Price Outlook As Charles Hoskinson Warns Over CLARITY Act
- Circle Stock Price Climbs 15% to $96, Can Rally Continue in March 2026?
- Bitcoin Price Prediction as US-Iran War Enters 4th Consecutive Day
- Top 5 Historical Reasons Dogecoin Price Is Not Rising


