XRP Price Prediction As Bear Trap Sets Recovery to $0.55


During September’s second-week sell-off in the crypto market, the XRP price breached the $0.486 local support. This slide, which was further exacerbated by a surge in trading volume, signaled the potential continuation of the bearish trend. However, in a twist of events, the price trend made a swift reversal, riding on the coattails of the overall bullish sentiment in the market. This bullish response has seen the prices move above their previously broken level, suggesting a failed breakdown. Here’s how this setup could impact the near future trend of the fifth-largest cryptocurrency.
Also Read: XRP Holders Prepare For Ripple’s Victory Party, Rally To $1?
Newfound Recovery Bolster Buyers For a Rally Above $0.52
- Sustained buying momentum sets the coin price for another 5% jump
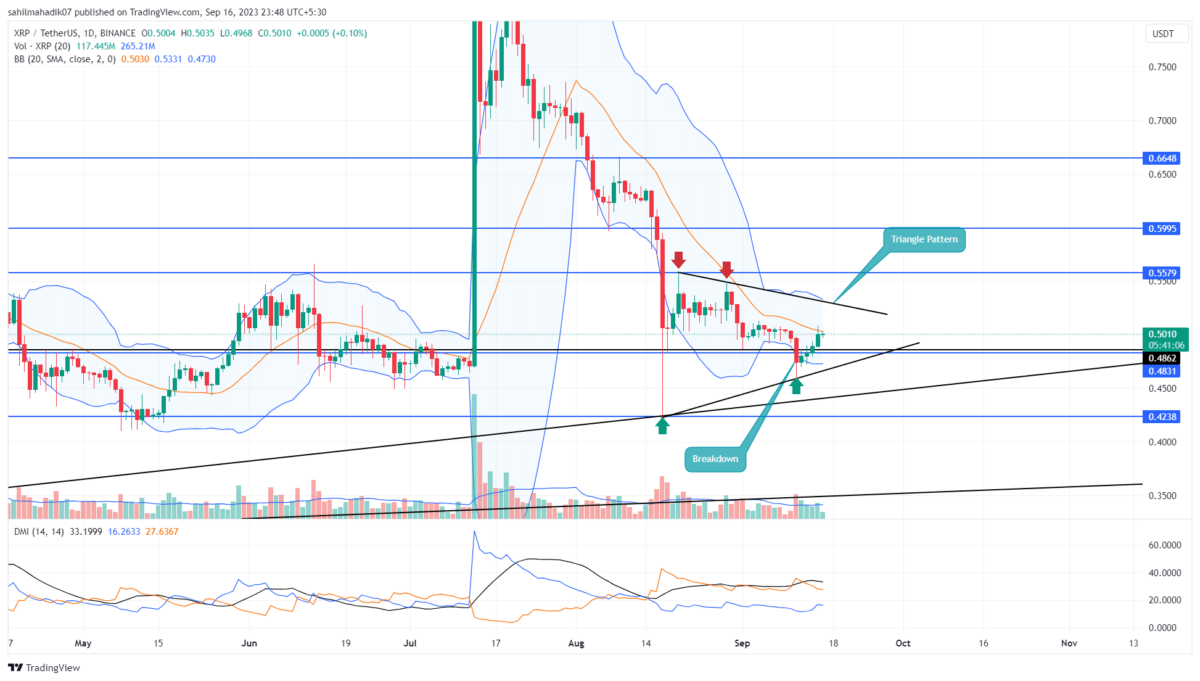
- The XRP price may prolong the sideways trend under the influence of a triangle pattern
- The intraday trading volume in the XRP is $619 Million, indicating a 13% loss
 Source: Tradingview
As the market’s bullish sentiment continues to permeate, XRP price has posted an impressive 8.6% gain over the past five days, placing its current trading price at $0.498. This positive momentum effectively nullified the recent breach of the $0.486 support, marking it as a possible bear trap.
Such scenarios tend to attract heightened buying activity as trapped short sellers look to exit their positions, thus driving the price up. This theory gained more traction when, on September 15th, the altcoin price surged past the high of the breakdown candle at $0.498, essentially neutralizing bearish intentions.
Given this momentum, if the bullish trend holds, the prices could see another 5% uptick, aiming for the overhead trend near the $0.52 mark. This descending resistance trendline has already stymied the coin’s growth twice and remains a barrier for bulls to surmount. If faced with rejection at this point, the XRP price may enter a consolidation phase, trading sideways in the coming days.
[converter id=”xrp-xrp” url=”https://coingape.com/price/converter/xrp-to-usd/?amount=1″]
Here’s How XRP Price May Trigger a Directional Rally
The daily time frame chart shows the XRP is currently trading within a symmetrical triangle, bounded by two converging trendlines. Such patterns typically indicate indecision in the market and often precede significant price moves, once a breakout (or breakdown) occurs. For the coin holder to instigate a more lasting recovery, it’s imperative for the bulls to shatter the overhead resistance trendline, confirming a bullish breakout from the symmetrical triangle. The post-breakout rally may set the first target at $0.55, followed by $0.6
- Bollinger Bands: The horizontal shift in the upper boundary of the Bollinger Bands indicates it might serve as a potential resistance, possibly hindering Ethereum’s ongoing relief rally.
- Directional Movement Index: A negative alignment between the DI+(blue) and DI-(orange) indicates the bearish momentum in action.

Why Trust CoinGape
CoinGape has covered the cryptocurrency industry since 2017, aiming to provide informative insights Read more…to our readers. Our journal analysts bring years of experience in market analysis and blockchain technology to ensure factual accuracy and balanced reporting. By following our Editorial Policy, our writers verify every source, fact-check each story, rely on reputable sources, and attribute quotes and media correctly. We also follow a rigorous Review Methodology when evaluating exchanges and tools. From emerging blockchain projects and coin launches to industry events and technical developments, we cover all facets of the digital asset space with unwavering commitment to timely, relevant information.

Related Articles


- Breaking: Michael Saylor’s Strategy Makes 100th Bitcoin Purchase, Buys 592 BTC as Market Struggles
- Satoshi-Era Whale Dumps $750M BTC as Hedge Funds Pull Out Billions in Bitcoin
- XRP Sees Largest Realized Loss Since 2022, History Points to Bullish Price Run: Report
- US Strike on Iran Possible Within Hours: Crypto Market on High Alert
- MetaSpace Will Take Its Top Web3 Gamers to Free Dubai Trip
- Top 4 Reasons Why Bitcoin Price Will Crash to $60k This Week
- COIN Stock Price Prediction: Will Coinbase Crash or Rally in Feb 2026?
- Shiba Inu Price Feb 2026: Will SHIB Rise Soon?
- Pi Network Price Prediction: How High Can Pi Coin Go?
- Dogecoin Price Prediction Feb 2026: Will DOGE Break $0.20 This month?
- XRP Price Prediction As SBI Introduces Tokenized Bonds With Crypto Rewards


