 Buy $GGs
XRP Price Prediction: Can Buyers Reclaim $0.5 With Current Market Surge?


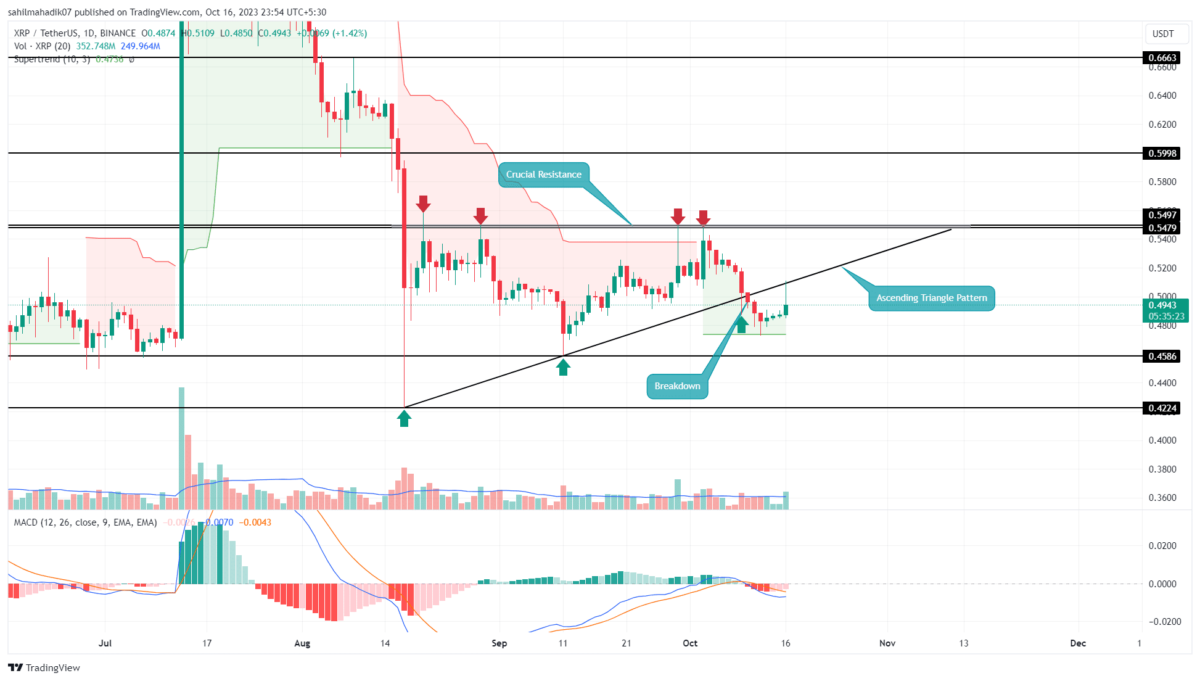
The first half of October saw the XRP price grappling with considerable selling pressure, dragging its price down from $0.548 to $0.473—a loss of nearly 13.8%. This decline also led to the breaching of the support trendline of an ascending triangle pattern, signaling potential bearishness for XRP price in the near term. Is this enough to go bearish on this altcoin?
Also Read: Cardano Founder Questions SEC’s Approach In XRP Lawsuit
Can XRP Price Reclaim $0.5?
- The bearish breakdown from the triangle pattern sets the coin price at 6%.
- The XRP price witnessed supply pressure around the $0.5 mark.
- The intraday trading volume in the XRP is $1.08 Billion, indicating a 182% gain
 Source: Tradingview
Earlier today, the leading cryptocurrency Bitcoin witnessed a significant inflow as the rumors spread around the SEC approving the spot Bitcoin ETF. This ripple effect boosted several major cryptocurrencies, including XRP, which saw an intraday gain of 4.82%.
However, the asset faced stiff resistance around $0.51 and even retested the previously breached support trendline of the ascending triangle pattern, now acting as resistance. A long rejection candle in the daily chart suggests that supply pressure remains strong and could continue to drive the correction.
If the price falls below today’s low of $0.485, likely, the XRP price could further slide by approximately 6% to reach the next support level at $0.458, and possibly even down to $0.42.
[converter id=”xrp-xrp” url=”https://coingape.com/price/converter/xrp-to-usd/?amount=1″]
XRP vs BTC Performance
 Source: Coingape| XRP Vs Bitcoin Price
Comparing the last three months, the Bitcoin price showcases better strength than the 5th largest cryptocurrency XRP. While the XRP price trend has shifted from downward to sideways, the Bitcoin price has evolved from a sideways movement to indicate some signs of recovery. This comparative analysis suggests a lack of aggressive bullish momentum in this altcoin,
- Super Trend: A transition of the super trend indicator from red to green projection reflects the buyers’ attempt to recover lost ground.
- Moving Average Convergence Average: A bearish crossover state between the MACD(blue) and signal(orange) slope reflects the downward trend remains intact.
Play 10,000+ Casino Games at BC Game with Ease
- Instant Deposits And Withdrawals
- Crypto Casino And Sports Betting
- Exclusive Bonuses And Rewards


Why Trust CoinGape
CoinGape has covered the cryptocurrency industry since 2017, aiming to provide informative insights Read more…to our readers. Our journal analysts bring years of experience in market analysis and blockchain technology to ensure factual accuracy and balanced reporting. By following our Editorial Policy, our writers verify every source, fact-check each story, rely on reputable sources, and attribute quotes and media correctly. We also follow a rigorous Review Methodology when evaluating exchanges and tools. From emerging blockchain projects and coin launches to industry events and technical developments, we cover all facets of the digital asset space with unwavering commitment to timely, relevant information.

Related Articles


- BTC Price Bounces as Spot Investors Buy The Dip Amid Iran War Jitters
- CFTC Chief Mike Selig Signals US Crypto Perpetual Futures Rollout in Coming Weeks
- Fed Rate Cut Odds Drop as Inflation Fears Rise Due To U.S. Iran Conflict
- Here’s Why Tether Gold (XAUt) Price Is Falling Even With Growing Gold Demand
- XRP News: Ripple Expands Payments Platform To Unify Fiat and Stablecoins Globally
- Gold Price Prediction March 2026: Rally, Crash, or Record Highs?
- RIOT Stock Prediction as Needham, Piper Sandler Slash Target After Earnings
- Cardano Price Outlook As Charles Hoskinson Warns Over CLARITY Act
- Circle Stock Price Climbs 15% to $96, Can Rally Continue in March 2026?
- Bitcoin Price Prediction as US-Iran War Enters 4th Consecutive Day
- Top 5 Historical Reasons Dogecoin Price Is Not Rising


